The author looks at ways of profiting from trends by using Moving Averages.
Identifying and profiting from trends can be at times divergent topics and this dissociation can easily translate to losing trades. While trend analysis, as defined by trend and channel lines, ratio and extension analysis is vital, traders should also go beyond pattern recognition and employ quantitative methods of analysis. One of the most popular tools is moving averages.
What Is a Moving Average?
A moving average smoothes market swings, as some traders prefer to keep the statistical noise at a low level. To calculate a simple average, simply determine the arithmetic mean. To make an average move, just add the last price of the period of you choice, while deducting the oldest price. Traders should keep it in mind that the more days you use, the more insensitive the average will become to the current price action.
Electronic charting services will generally allow you to average several prices of the period of your choice, such as opening, high, low, midpoint and closing prices. The averages, like all the other analytical methods, were developed for daily prices. To this day, most traders use the closing price for averaging because it is the most important price of the day.
What Type of Tool is a Moving Average?
A moving average is only a lagging indicator. This means that this tool is about the last one to react to a change in the current currency price, so don't expect it to be a trail blazer.
Another important thing to keep in mind is the fact that moving averages are working at their best only in trending markets. Consequently, traders should diminish their usage of the averages in sideways markets.
Reasons to Use Moving Averages
Many traders tend to have biases when using moving averages. For improved trading ability, it is important to know all of their uses.
Some will like a smoother view of the currency; it's a valid point, but not a money maker.
Once one moves into the applied analysis, a trader should consider moving averages as flexible support and resistance lines.
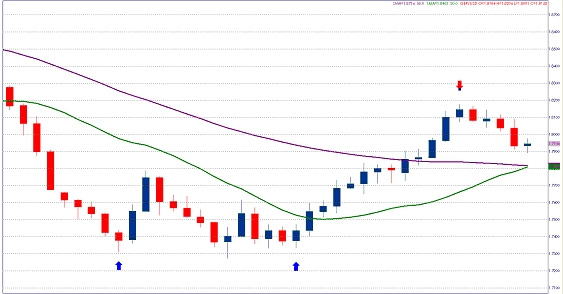
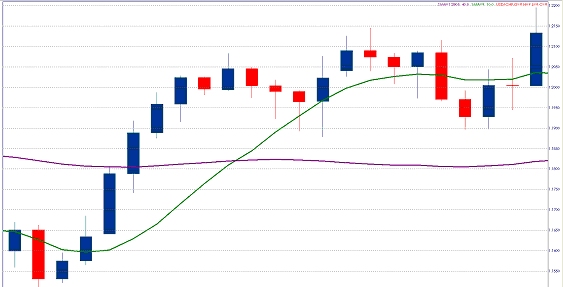
The intersection between the market and a short moving average, perhaps between 10 and 30 days, should provide good buy and sell signals during trending markets. For instance, in Figure 1, the intersections between the euro/dollar and the 25-day moving average provide two buying signals (blue arrows) and a selling signal (red arrow).
The idea is to go long the currency when it crosses above such a relatively short moving average and hold that position - if in a trending market - for as long as the currency holds above this average. In reverse, a downward crossover between the currency price and the support of a moving average on a closing basis suggests that the trader should short that currency.
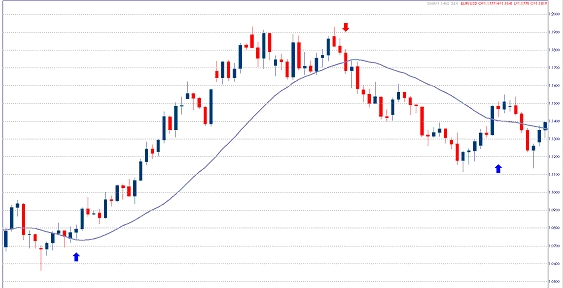
caption: Figure 1. The intersections between the daily euro/dollar and the 25-day moving average provide two buying signals (blue arrows) and a selling signal (red arrow).
Another reason to employ moving averages in your work is the overbought and oversold signals that may occur when compared to the currency. If the underlying currency and the moving average are trailing too far away from each other, this is a warning that the currency might change direction. However, a divergence on its own is a condition, not a signal, so use a trigger from a different source, such as the break below a support or a trend line to act in the market.
As Figure 2 shows, the euro/sterling cross is well above its 25-day moving average in two instances, in both case to the left of the vertical lines.
One way to lessen the overbought condition is for the currency pair to trade sideways, giving time to the lagging averages to catch up.
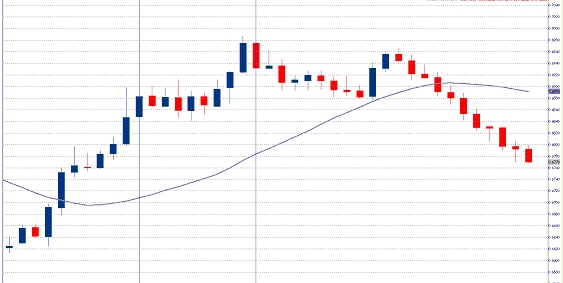
caption: Figure 2. There are two divergence instances between the euro/sterling and its 25-day moving average; the cross traded sideways and this allowed the average to get closer to the pair.
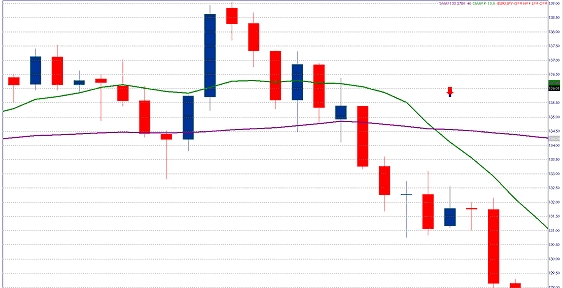
Another way to alleviate the overbought condition is for the pair to fall and intersect the lagging average. In Figure 3, the overbought dollar/yen formed a bearish candlestick reversal signal at the highest point of the chart and then headed straight down to reach its 25 day moving average.
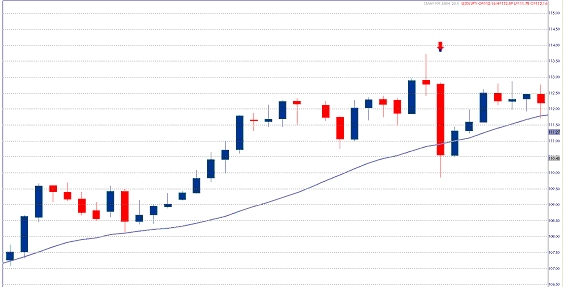
caption: Figure 3. The overbought dollar/yen formed a bearish candlestick reversal signal at the highest point of the chart and then fell to reach its 25 day moving average.
The divergence between a currency and its moving average on the daily charts tends to provide a short-term divergence signal. To identify medium-term overbought or oversold conditions, traders use either a weekly currency and its average, or they compare two moving averages plotted on the daily charts.
Figure 4 shows two instances where the Australian dollar was overbought versus the US currency on a weekly basis (see red arrows) and two examples where it was oversold (blue arrows).
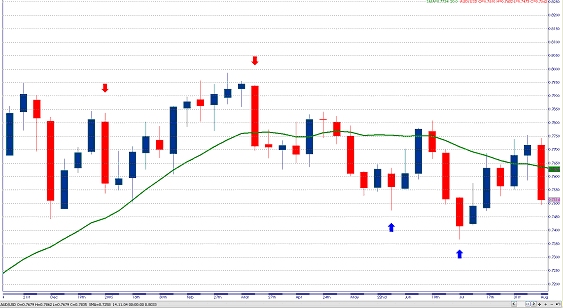
caption: Figure 4. The Australian dollar is overbought versus the US currency on a weekly basis.
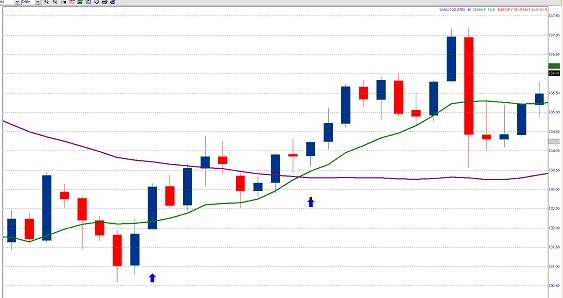
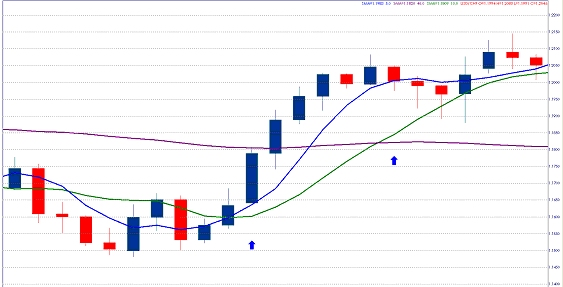
Figure 5 shows the daily sterling/dollar being oversold. The first blue arrow points a short-term oversold condition, as defined by the distance between the currency pair and the 20-day moving average (which is denoted by a green line). The currency promptly approached that average and alleviated this condition. By the time sterling/dollar reached the area of the second blue arrow, it was close to the 20-day moving average, but that average was too far away from the 50-day moving average. The signal to attempt alleviating this medium-term oversold condition was given by the upward crossover of the sterling/dollar above the 20-day moving average. The red arrow points to a short term overbought example.
caption: Figure 5. The first blue arrow points a short-term oversold condition of the daily sterling/dollar. The second blue arrow shows a medium-term oversold condition. The red arrow points to a short term overbought situation.
One of most common reasons to use averages is the intersection between two moving averages - this is known as the double crossover method.
However, given that the averages are lagging tools, they tend to be better confirmation signals than entry or exit signals. On a combination of two moving averages, a buying signal occurs when the shorter of two averages intersects the longer one upward. This strategy provides many false breakouts.
For instance, as you can see in Figure 6, the first blue arrow points to an entry signal, as defined by the upward crossover of the euro/yen cross above the 10-day moving average. The second arrow points to the upward crossover of the 10-day moving average above the 40-day moving average. The second signal is late.
caption: Figure 6. Buying signal generated by the intersection of a 10-day and a 40-day moving averages on the euro/yen chart.
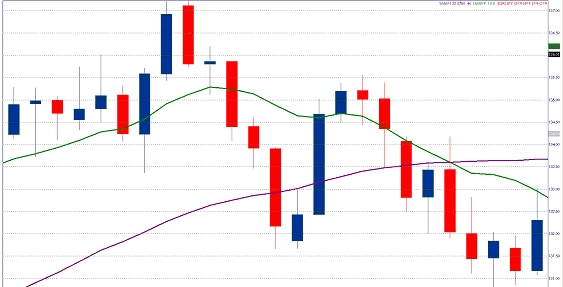
The selling signal is seen when the shorter moving average (10-day) intersects a longer one downward (40-day). See Figure 7.
caption: Figure 7. Selling signal generated by the intersection of 10-day and 40-day moving averages on the euro/yen daily chart.
A variation of the double crossover method is the Japanese cross: a dead cross and a golden cross.
A dead cross is formed by the intersection of two consecutive moving averages that move in opposite directions. This type of cross is very inconsistent in its signals and should be disregarded. See Figure 8.
caption: Figure 8. A dead cross signal generated by the intersection of the 10- and 40-day moving averages on the euro/yen chart.
The intersection of two moving averages that move in the same direction is called a golden cross. This intersection provides a more reliable signal that the currency will continue moving in the same direction. See an example of a gold crossover in dollar/Swiss franc in Figure 9.
caption: Figure 9. A golden cross between the 10-day moving average and 40-day moving average on the daily dollar/Swiss franc chart.
A strategy involving three moving averages is called the triple crossover method. The intersection of short and middle lines provides a warning signal, and the intersection the middle and long averages should give a trading signal. Let's take the example of the signals generated by the combination of the fast 5-, 10- and 20-day moving averages. As shown in Figure 10, the warning to buy dollar/Swiss franc signal occurs when the 5-day moving average crosses the upward moving 10-day average. The buying signal occurs when the 10-day moving average crosses the 20-day average upward. In reality, the warning signal, pointed by the first arrow, worked as a buying signal. Meanwhile, the buying signal was late and would have led to a losing trade.
caption: Figure 10. A warning signal (first arrow) and a buying signal (second arrow), generated by a combination of the 5-, 10- and 40-day moving averages on the daily dollar/Swiss franc chart.
Number of Moving Averages
Generally, traders should use at least one an up to four moving averages in order to capture signals in different time frames. There are no general suggestions in terms of the number of averages to use or their length. Remember that some markets are more volatile than others.
In terms of length, some of the more popular combinations are 4-9-18 days for the very short-term oriented traders and 5-20-60 for the medium-term traders. In addition to plotting moving averages on a daily basis, traders can use any other periods, whether short-term or long-term: 15 minutes, hourly, weekly, etc.
In conclusion, moving averages are good flexible support and resistance lines that also point overbought and oversold conditions. Their intersections are slow in showing directional changes and entry/exit points. Use intersections between the currency and the moving averages intersections to traded and moving averages intersections as confirmations for existing positions.
Identifying and profiting from trends can be at times divergent topics and this dissociation can easily translate to losing trades. While trend analysis, as defined by trend and channel lines, ratio and extension analysis is vital, traders should also go beyond pattern recognition and employ quantitative methods of analysis. One of the most popular tools is moving averages.
What Is a Moving Average?
A moving average smoothes market swings, as some traders prefer to keep the statistical noise at a low level. To calculate a simple average, simply determine the arithmetic mean. To make an average move, just add the last price of the period of you choice, while deducting the oldest price. Traders should keep it in mind that the more days you use, the more insensitive the average will become to the current price action.
Electronic charting services will generally allow you to average several prices of the period of your choice, such as opening, high, low, midpoint and closing prices. The averages, like all the other analytical methods, were developed for daily prices. To this day, most traders use the closing price for averaging because it is the most important price of the day.
What Type of Tool is a Moving Average?
A moving average is only a lagging indicator. This means that this tool is about the last one to react to a change in the current currency price, so don't expect it to be a trail blazer.
Another important thing to keep in mind is the fact that moving averages are working at their best only in trending markets. Consequently, traders should diminish their usage of the averages in sideways markets.
Reasons to Use Moving Averages
Many traders tend to have biases when using moving averages. For improved trading ability, it is important to know all of their uses.
Some will like a smoother view of the currency; it's a valid point, but not a money maker.
Once one moves into the applied analysis, a trader should consider moving averages as flexible support and resistance lines.
The intersection between the market and a short moving average, perhaps between 10 and 30 days, should provide good buy and sell signals during trending markets. For instance, in Figure 1, the intersections between the euro/dollar and the 25-day moving average provide two buying signals (blue arrows) and a selling signal (red arrow).
The idea is to go long the currency when it crosses above such a relatively short moving average and hold that position - if in a trending market - for as long as the currency holds above this average. In reverse, a downward crossover between the currency price and the support of a moving average on a closing basis suggests that the trader should short that currency.
caption: Figure 1. The intersections between the daily euro/dollar and the 25-day moving average provide two buying signals (blue arrows) and a selling signal (red arrow).
Another reason to employ moving averages in your work is the overbought and oversold signals that may occur when compared to the currency. If the underlying currency and the moving average are trailing too far away from each other, this is a warning that the currency might change direction. However, a divergence on its own is a condition, not a signal, so use a trigger from a different source, such as the break below a support or a trend line to act in the market.
As Figure 2 shows, the euro/sterling cross is well above its 25-day moving average in two instances, in both case to the left of the vertical lines.
One way to lessen the overbought condition is for the currency pair to trade sideways, giving time to the lagging averages to catch up.
caption: Figure 2. There are two divergence instances between the euro/sterling and its 25-day moving average; the cross traded sideways and this allowed the average to get closer to the pair.
Another way to alleviate the overbought condition is for the pair to fall and intersect the lagging average. In Figure 3, the overbought dollar/yen formed a bearish candlestick reversal signal at the highest point of the chart and then headed straight down to reach its 25 day moving average.
caption: Figure 3. The overbought dollar/yen formed a bearish candlestick reversal signal at the highest point of the chart and then fell to reach its 25 day moving average.
The divergence between a currency and its moving average on the daily charts tends to provide a short-term divergence signal. To identify medium-term overbought or oversold conditions, traders use either a weekly currency and its average, or they compare two moving averages plotted on the daily charts.
Figure 4 shows two instances where the Australian dollar was overbought versus the US currency on a weekly basis (see red arrows) and two examples where it was oversold (blue arrows).
caption: Figure 4. The Australian dollar is overbought versus the US currency on a weekly basis.
Figure 5 shows the daily sterling/dollar being oversold. The first blue arrow points a short-term oversold condition, as defined by the distance between the currency pair and the 20-day moving average (which is denoted by a green line). The currency promptly approached that average and alleviated this condition. By the time sterling/dollar reached the area of the second blue arrow, it was close to the 20-day moving average, but that average was too far away from the 50-day moving average. The signal to attempt alleviating this medium-term oversold condition was given by the upward crossover of the sterling/dollar above the 20-day moving average. The red arrow points to a short term overbought example.
caption: Figure 5. The first blue arrow points a short-term oversold condition of the daily sterling/dollar. The second blue arrow shows a medium-term oversold condition. The red arrow points to a short term overbought situation.
One of most common reasons to use averages is the intersection between two moving averages - this is known as the double crossover method.
However, given that the averages are lagging tools, they tend to be better confirmation signals than entry or exit signals. On a combination of two moving averages, a buying signal occurs when the shorter of two averages intersects the longer one upward. This strategy provides many false breakouts.
For instance, as you can see in Figure 6, the first blue arrow points to an entry signal, as defined by the upward crossover of the euro/yen cross above the 10-day moving average. The second arrow points to the upward crossover of the 10-day moving average above the 40-day moving average. The second signal is late.
caption: Figure 6. Buying signal generated by the intersection of a 10-day and a 40-day moving averages on the euro/yen chart.
The selling signal is seen when the shorter moving average (10-day) intersects a longer one downward (40-day). See Figure 7.
caption: Figure 7. Selling signal generated by the intersection of 10-day and 40-day moving averages on the euro/yen daily chart.
A variation of the double crossover method is the Japanese cross: a dead cross and a golden cross.
A dead cross is formed by the intersection of two consecutive moving averages that move in opposite directions. This type of cross is very inconsistent in its signals and should be disregarded. See Figure 8.
caption: Figure 8. A dead cross signal generated by the intersection of the 10- and 40-day moving averages on the euro/yen chart.
The intersection of two moving averages that move in the same direction is called a golden cross. This intersection provides a more reliable signal that the currency will continue moving in the same direction. See an example of a gold crossover in dollar/Swiss franc in Figure 9.
caption: Figure 9. A golden cross between the 10-day moving average and 40-day moving average on the daily dollar/Swiss franc chart.
A strategy involving three moving averages is called the triple crossover method. The intersection of short and middle lines provides a warning signal, and the intersection the middle and long averages should give a trading signal. Let's take the example of the signals generated by the combination of the fast 5-, 10- and 20-day moving averages. As shown in Figure 10, the warning to buy dollar/Swiss franc signal occurs when the 5-day moving average crosses the upward moving 10-day average. The buying signal occurs when the 10-day moving average crosses the 20-day average upward. In reality, the warning signal, pointed by the first arrow, worked as a buying signal. Meanwhile, the buying signal was late and would have led to a losing trade.
caption: Figure 10. A warning signal (first arrow) and a buying signal (second arrow), generated by a combination of the 5-, 10- and 40-day moving averages on the daily dollar/Swiss franc chart.
Number of Moving Averages
Generally, traders should use at least one an up to four moving averages in order to capture signals in different time frames. There are no general suggestions in terms of the number of averages to use or their length. Remember that some markets are more volatile than others.
In terms of length, some of the more popular combinations are 4-9-18 days for the very short-term oriented traders and 5-20-60 for the medium-term traders. In addition to plotting moving averages on a daily basis, traders can use any other periods, whether short-term or long-term: 15 minutes, hourly, weekly, etc.
In conclusion, moving averages are good flexible support and resistance lines that also point overbought and oversold conditions. Their intersections are slow in showing directional changes and entry/exit points. Use intersections between the currency and the moving averages intersections to traded and moving averages intersections as confirmations for existing positions.
Last edited by a moderator: