Shakone
Senior member
- Messages
- 2,460
- Likes
- 665
For my own education, and perhaps others, I'm looking at why price turned where it did. I'm interested in any reasons that you can reasonably back up. If you think it is because of a Fib retracement, something on the DOM in the respective future, market profile, manipulation, stop run, a trendline, whatever (that includes indicators!), I'm interested in hearing it.
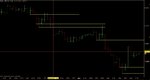
So my own 'model' of price thinks of it as moving between areas of potential support and resistance, on different timeframes. I draw a region around recent lows (horizontal lines), and if broken through, I leave them there for a possible SbR or RbS effect.
Now 1st March, 8am bar, we see a move up above the overnight high (stops taken?), above the 28th Feb 5pm bar (more stops?) and into previous potential support become resistance area with confluence of the round number 1.3100 and it turns there.
Now I didn't know it would turn there, not many people would know, but there was at least a reasonable expectation that it 'could'. This is important as it means we can take profits or adjust stops, manage our position better etc.
So then I am interested in the unusual ones that don't fit into my model, that will fit into many of yours I'm sure.
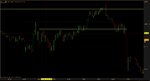
So why the turn at the low 1.2967. The time 3pm is relevant to me. Aside from the U.S. news out then, we quite often get a reversal around this time. but why at 1.2967, but why not push a bit lower to 1.2950 or wherever else?
Also why the turn at 1.3042 at the 5pm bar?
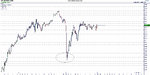
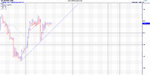
P.S. please post any other charts in which you were confused/surprised by the location of a turn. I am thinking that if it progresses we will find a core set of ideas that relate to most (but never all) turns.
So my own 'model' of price thinks of it as moving between areas of potential support and resistance, on different timeframes. I draw a region around recent lows (horizontal lines), and if broken through, I leave them there for a possible SbR or RbS effect.
Now 1st March, 8am bar, we see a move up above the overnight high (stops taken?), above the 28th Feb 5pm bar (more stops?) and into previous potential support become resistance area with confluence of the round number 1.3100 and it turns there.
Now I didn't know it would turn there, not many people would know, but there was at least a reasonable expectation that it 'could'. This is important as it means we can take profits or adjust stops, manage our position better etc.
So then I am interested in the unusual ones that don't fit into my model, that will fit into many of yours I'm sure.
So why the turn at the low 1.2967. The time 3pm is relevant to me. Aside from the U.S. news out then, we quite often get a reversal around this time. but why at 1.2967, but why not push a bit lower to 1.2950 or wherever else?
Also why the turn at 1.3042 at the 5pm bar?
P.S. please post any other charts in which you were confused/surprised by the location of a turn. I am thinking that if it progresses we will find a core set of ideas that relate to most (but never all) turns.