Forexmospherian
Legendary member
- Messages
- 39,928
- Likes
- 3,306
Lets start off by saying indicators lag and are connected to Price movements and so on most Brokers platforms they are really a waste of time. As a good analogue its like being told its raining - just after you have got wet through and are drying out ;-)
I would also say the average Brokers chart package is about as accurate as a 1950's Buick's speedometer - ie when it showing 60 mph - you were probably doing only 51 mph - ie over a 10-15% error.
This is just one of the reasons why I ignore the commercial trading world favourite - ie the ubiquitous 20 / 50 / 100 and 200 moving average set up - on what ever lagging time frame you want to view it on.
Even on a 1 hr time frame - which is just far too lagging for a Intraday trader - a move will have already gone 10 -25 pips - before you get any real clues . Ie a possible trade with a RR of 3 or 4 plus already happening - and you just ignore it ;-) ?
Is there an answer - sure - yes you could tighten up what ever type of MA you use ie try an 8 or a 10 for a start - but its still way behind the action .
My answer is a far better indicator that if required can be used on any time frame and is far superior to any MA - yes the LR - or linear regression indicator ( not lines or slope - different again )
I will not bore you with all the technical advantages - but will provide links to read about them in more detail in future comments.
The nice thing I like about them is that they are just more accurate - and on the correct settings -( which is never the standard settings on any indicator) they will go over and under price and give you great clues on what will happen next.
I first started using after being recommended the Intellicharts Pro set up - which at the time ( 2004 /5) had a unique setting on a LR 2 - that just could not be replicated on other brokers charts.
That got me interested and then after playing with LR's on 4 different brokers charts - i was amazed by how much they differed - ie not just say 1 -3 pips - but in some cases readings could be 15 and 20 pips out ( yes 1950's Buick speedo's all over again )
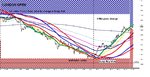
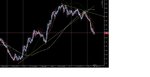
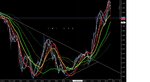
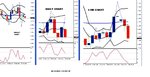
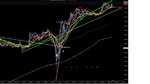
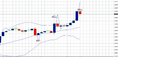
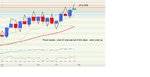
Lets start by giving you example of clues for reading price on 2 of my favourite charts - ie 10 second Tick chart and the 1 minute.
I will attach a few charts on different pairs and then go on later to explain more later
Please view attachments to follow as well
Regards
F
I would also say the average Brokers chart package is about as accurate as a 1950's Buick's speedometer - ie when it showing 60 mph - you were probably doing only 51 mph - ie over a 10-15% error.
This is just one of the reasons why I ignore the commercial trading world favourite - ie the ubiquitous 20 / 50 / 100 and 200 moving average set up - on what ever lagging time frame you want to view it on.
Even on a 1 hr time frame - which is just far too lagging for a Intraday trader - a move will have already gone 10 -25 pips - before you get any real clues . Ie a possible trade with a RR of 3 or 4 plus already happening - and you just ignore it ;-) ?
Is there an answer - sure - yes you could tighten up what ever type of MA you use ie try an 8 or a 10 for a start - but its still way behind the action .
My answer is a far better indicator that if required can be used on any time frame and is far superior to any MA - yes the LR - or linear regression indicator ( not lines or slope - different again )
I will not bore you with all the technical advantages - but will provide links to read about them in more detail in future comments.
The nice thing I like about them is that they are just more accurate - and on the correct settings -( which is never the standard settings on any indicator) they will go over and under price and give you great clues on what will happen next.
I first started using after being recommended the Intellicharts Pro set up - which at the time ( 2004 /5) had a unique setting on a LR 2 - that just could not be replicated on other brokers charts.
That got me interested and then after playing with LR's on 4 different brokers charts - i was amazed by how much they differed - ie not just say 1 -3 pips - but in some cases readings could be 15 and 20 pips out ( yes 1950's Buick speedo's all over again )
Lets start by giving you example of clues for reading price on 2 of my favourite charts - ie 10 second Tick chart and the 1 minute.
I will attach a few charts on different pairs and then go on later to explain more later
Please view attachments to follow as well
Regards
F