Where is the Dow & others heading in 2005?

Indu

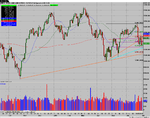
After last weeks sharp late week selloff, Monday gave some follow through and took the index to within 3 points of 10,250, the level I and some others had listed as a potential support. From there the index put in an impressive bounce with a triple digit gain on Tuesday, but as was pointed out at the time, the lack of volume cautioned against seeing it as anything more than a bounce. After a brief follow through Wednesday the caution proved well founded as the sellers stepped in to take control. Thursday saw an opening gap up which immediately attracted sellers and the index sold off ahead of the FOMC announcement. The Fed announced a 1/4 point increase as expected and maintained their "measured pace" wording, that suggests further increases. The market promptly sold off with volume again increasing for a triple digit loss. A small bounce Friday leading into the weekend saw the Index finish fractionally higher for the week.
Looking forward to next week sees us in a similar situation to last week.

To the downside we have 10,250 area, which marks a late April swing high and the 61% fib retrace of the move up. This area provided support last week, can it do it again? Below that I have a trendline (ohlc) from the April low at about 10,230, followed by a swing low from mid-May, closing price of 10,140 which coincides with the 78.6% fib ret. which also ties in fairly closely with a trendline from late Oct. Beyond that is 10,048 as the low of the first selloff attempt after the bounce from the April lows.

To the upside, 10,398, current location of the 50 day sma, this area proved resistance on an intraday basis last week and is also linked to a swing high from early May and really extends to 10,433 which is the swing high of the last bounce from 250. Followed by 10,445 which is the current location of the 200 day sma Essentially the INDU has a lot of overhead all in close proximity and any advance from here would be impressive.
 

Attachments

  • INDU daily.png
    INDU daily.png
    61.1 KB · Views: 158
Spx

The pattern in the SPX was similar to the INDU this week though initially on Monday SPX resisted follow through of the previous weeks selloff finding support around 1191 a swing high from early April before eventually moving down to 1188, 1 point off the 38.2% fib retrace of the move up from April lows. From this point it bounced like the INDU into Wednesday before selling of through Thursday and finishing with a small bounce Friday.
The SPX continues to show relative strength compared to INDU, since its high point on June 17th has only retraced 38.2% of the move up from the April lows, in marked contrast to INDU which has retraced 61% of the move. SPX also remains above both its 50 and 200 day sma's.

To the downside SPX has potential support at 1191,the swing high from early April and below that the 38.2% fib retrace which now coincides with a trendline on a closing price basis from the April lows. Also the 50 day sma sits just below this, currently at 1186. Below that we have a swing high from early May at around 1179 and also the 50% retrace at 1177. Followed by the 200 day sma at 1175.

To the upside potential resistance 20 day sma currently at 1202 with the recent swing high from the last bounce at 1204. Followed by a push back up to 1219. Clearly the SPX has a fair amount of potential support below, but it would be optimistic to trivialise the overhead resistance, selling was heavy on the way down and it will take considerable momentum to get back up there, a feat that will be difficult if the INDU continues to act as a drag,
 

Attachments

  • SPX daily.png
    SPX daily.png
    46.3 KB · Views: 133
Compq

Like the Dow and S&P the Nasdaq comp followed through on Monday from last weeks weakness breaking potential support in the 2050 area bottoming at 2040 on Monday before beginning the bounce. Similarly Tuesday saw a gap and go day reaching a high on Wednesday. The Nasdaq however challenged that high twice on Thursday before moving lower post FOMC. Another sign of the relative strength is the gap that was opened on Tuesday morning remains open.
The COMPQ or Nasdaq composite has been the strong sister since the indices bottomed in April, since reaching an intraday high of 2106 the index has retraced fractionally more than 25% of its gains and now sits once more above that level. Like the SPX the COMPQ is still above both 50 and 200 day sma's.

To the downside COMPQ has potential support at 2050 ish which represented the close of an open gap and has provided support recently. Below this level 2045 would be the close of the gap from Tuesday, then the 200 day sma at 2032 and the 50 day sma at 2027. Then we have the 38.2% fib at 2023 and just below that a swing high from early April at 2020.

To the upside potential resistance can be found with the 20 day sma at 2071, followed by the high of the recent bounce at 2076. Beyond that 2100 which kept the index in check for a couple of weeks. Again as with the SPX a considerable amount of potential support lies below, but one would be foolish to under estimate the overhead resistance
 

Attachments

  • COMPQ daily.png
    COMPQ daily.png
    47.6 KB · Views: 140
A thought for the weekend...

If the BOJ sold dollars at the rate of $4 billion a day, it would take them 200 trading days to get out of its dollar reserves.

And

In 1929 the market capitalization of the 846 listed companies of the New York Stock Exchange was $89.7 billion, at 1.24 times 1929 GDP. By current standards, a case could be built that stocks in 1929 were in fact technically undervalued.

Dollar hegemony
 
Last edited:
RT here's some info for you mate:

Commercial Traders: This group consists of traders that use futures contracts for hedging purposes and whose positions exceed government reporting levels. These traders are usually involved with the production and/or processing of the underlying commodity.

Large Traders: This group consists of traders that don't use futures contracts for hedging and whose positions exceed government reporting levels. They are typically large traders such as clearing houses, futures commission merchants, foreign brokers, etc.

Small Traders: The positions of these traders do not exceed government reporting levels, and as the name implies, these are usually small traders.

Have a good week......

I'm now long since Friday 5.00am UK time. The overall picture is pretty bearish and looking extremely bad! We have some serious downside targets that will should be seen in the next few years. I'm currently sitting with a dangerous long looking for some upward action before the downside storm arrives....
 
Joules I know you like your stats but who doesn't!? :devilish:

Here goes:

.......A strategy that has given good returns:

Go Long when the Institutions are net long the S&Ps (for buys) and Go Short when institutions are net short (for sells).

Expected Result: S&P500 will be trading at a higher level (for buys) or a lower level (for sells) by the time institutions reverse positions.

Accuracy:
70%
56 out of 80 winners (70%) since 1983

Track Record:
Beginning Portfolio Value: $10,000 (started 01/01/83)
Current Portfolio Value: $3,718,013 (as of 03/19/04)
Return on Investment: +37,080% vs. +1,328% for Buy&Hold during same period

Trade Entry Date Close Date Profit Cumulative Profit
Long 2/4/1983 1/6/1984 $3,166.83 $3,166.83
Short 1/6/1984 3/2/1984 $1,561.85 $4,728.68
Long 3/2/1984 6/1/1984 -$1,109.92 $3,618.76
Short 6/1/1984 7/6/1984 $177.74 $3,796.50
Long 7/6/1984 8/31/1984 $2,617.20 $6,413.70
Short 8/31/1984 11/1/1985 -$4,894.17 $1,519.53
Long 11/1/1985 1/3/1986 $2,327.60 $3,847.13
Short 1/3/1986 1/31/1986 -$118.19 $3,728.94
Long 1/31/1986 3/14/1986 $3,211.50 $6,940.44
Short 3/14/1986 5/16/1986 $542.84 $7,483.28
Long 5/16/1986 7/3/1986 $2,858.79 $10,342.07
Short 7/3/1986 7/18/1986 $2,493.17 $12,835.24
Long 7/18/1986 9/19/1986 -$801.88 $12,033.36
Short 9/19/1986 10/3/1986 -$284.66 $11,748.70
Long 10/3/1986 9/4/1987 $15,445.85 $27,194.55
Short 9/4/1987 9/18/1987 $432.20 $27,626.75
Long 9/18/1987 10/2/1987 $3,157.28 $30,784.03
Short 10/2/1987 10/30/1987 $18,965.50 $49,749.53
Long 10/30/1987 12/18/1987 -$1,257.68 $48,491.85
Short 12/18/1987 12/31/1987 $962.58 $49,454.43
Long 12/31/1987 2/3/1989 $24,004.10 $73,458.53
Short 2/3/1989 2/17/1989 $118.03 $73,576.56
Long 2/17/1989 8/4/1989 $26,563.35 $100,139.91
Short 8/4/1989 8/18/1989 -$1,351.44 $98,788.47
Long 8/18/1989 1/17/1992 $45,794.08 $144,582.55
Short 1/17/1992 2/28/1992 $4,546.75 $149,129.30
Long 2/28/1992 12/15/1995 $157,039.45 $306,168.75
Short 12/15/1995 12/22/1995 $4,503.97 $310,672.72
Long 12/22/1995 2/16/1996 $37,760.69 $348,433.41
Short 2/16/1996 3/8/1996 $16,008.28 $364,441.69
Long 3/8/1996 12/6/1996 $125,410.81 $489,852.50
Short 12/6/1996 12/20/1996 -$12,530.13 $477,322.37
Long 12/20/1996 6/20/1997 $195,001.88 $672,324.25
Short 6/20/1997 6/27/1997 $17,325.81 $689,650.06
Long 6/27/1997 7/11/1997 $46,349.50 $735,999.56
Short 7/11/1997 8/15/1997 $25,830.19 $761,829.75
Long 8/15/1997 9/5/1997 $48,393.06 $810,222.81
Short 9/5/1997 9/19/1997 -$37,892.50 $772,330.31
Long 9/19/1997 9/26/1997 -$8,708.06 $763,622.25
Short 9/26/1997 10/31/1997 $50,089.56 $813,711.81
Long 10/31/1997 12/5/1997 $124,589.75 $938,301.56
Short 12/5/1997 12/12/1997 $58,606.69 $996,908.25
Long 12/12/1997 12/26/1997 -$35,760.69 $961,147.56
Short 12/26/1997 1/9/1998 $18,189.75 $979,337.31
Long 1/9/1998 1/23/1998 $63,752.56 $1,043,089.87
Short 1/23/1998 2/20/1998 -$168,546.19 $874,543.68
Long 2/20/1998 3/13/1998 $58,843.63 $933,387.31
Short 3/13/1998 5/1/1998 -$92,536.94 $840,850.37
Long 5/1/1998 5/8/1998 -$19,551.75 $821,298.62
Short 5/8/1998 5/15/1998 -$885.13 $820,413.49
Long 5/15/1998 6/26/1998 $36,654.88 $857,068.37
Short 6/26/1998 8/7/1998 $66,950.69 $924,019.06
Long 8/7/1998 12/18/1998 $169,031.44 $1,093,050.50
Short 12/18/1998 12/24/1998 -$71,009.38 $1,022,041.12
Long 12/24/1998 1/8/1999 $82,174.75 $1,104,215.87
Short 1/8/1999 1/15/1999 $55,628.13 $1,159,844.00
Long 1/15/1999 1/29/1999 $68,463.50 $1,228,307.50
Short 1/29/1999 2/5/1999 $77,880.50 $1,306,188.00
Long 2/5/1999 2/26/1999 -$2,272.75 $1,303,915.25
Short 2/26/1999 3/5/1999 -$78,814.00 $1,225,101.25
Long 3/5/1999 3/12/1999 $37,029.75 $1,262,131.00
Short 3/12/1999 3/26/1999 $23,170.75 $1,285,301.75
Long 3/26/1999 7/2/1999 $218,953.13 $1,504,254.88
Short 7/2/1999 7/23/1999 $74,623.25 $1,578,878.13
Long 7/23/1999 11/12/1999 $91,566.75 $1,670,444.88
Short 11/12/1999 11/24/1999 -$50,652.50 $1,619,792.38
Long 11/24/1999 12/10/1999 -$91.88 $1,619,700.50
Short 12/10/1999 1/28/2000 $130,855.38 $1,750,555.88
Long 1/28/2000 2/18/2000 -$36,450.00 $1,714,105.88
Short 2/18/2000 2/25/2000 $32,559.00 $1,746,664.88
Long 2/25/2000 4/7/2000 $482,168.38 $2,228,833.26
Short 4/7/2000 4/28/2000 $188,750.75 $2,417,584.01
Long 4/28/2000 5/19/2000 -$152,030.50 $2,265,553.51
Short 5/19/2000 3/28/2003 $1,757,980.00 $4,023,533.51
Long 3/28/2003 6/27/2003 $1,053,274.00 $5,076,807.50
Short 6/27/2003 1/23/2004 -$1,722,977.00 $3,353,830.50
Long 1/23/2004 2/06/2004 $7,130.75 $3,360,961.25
Short 2/06/2004 2/20/2004 -$7,965.40 $3,352,995.85
Long 2/20/2004 3/05/2004 $74,954.75 $3,427,950.60
Short 3/05/2004 3/19/2004 $280,062.00 $3,708,012.60
 
Oracle said that as of June 30, 2005, currency is expected to have a negative effect of 2% on total revenues for the full year and the expected currency impact for the first fiscal quarter is unchanged at positive 2%.

With the dollar going up so much and earnings coming out soon, will other companies say something about the currency? They have had the benefits of the dollar dropping a lot up to now.
 
With the dollar going up so much and earnings coming out soon, will other companies say something about the currency? They have had the benefits of the dollar dropping a lot up to now.
I would imagine companies that do a lot of foreign business and cited a weak dollar as a benefit to them in the last earnings cycle should in theory start to feel the pinch of a strengthening dollar. I don't know if they have any means to hedge against this in some way. Earnings season picks up pace from around July 11th, it is interesting that the pre-announcement season has been fairly quiet.
 
roguetrader said:
I would imagine companies that do a lot of foreign business and cited a weak dollar as a benefit to them in the last earnings cycle should in theory start to feel the pinch of a strengthening dollar. I don't know if they have any means to hedge against this in some way. Earnings season picks up pace from around July 11th, it is interesting that the pre-announcement season has been fairly quiet.

Saw the warnings rate was a bit higher than average somewhere?... can't find the details now
 
Racer said:
Saw the warnings rate was a bit higher than average somewhere?... can't find the details now
That's interesting, thanx, I was just going by the impression that I hadn't heard a lot, maybe I just wasn't paying as much attention as I should have been :)
From various analyst interviews etc on Bloomberg, it seems that slower earnings are widely expected and in theory should already be priced into the market. Though my experience has been that often although the market prices bad news in, it seems to have a little more difficulty in dealing with the realization that things really are bad so you still get a reaction.
 
Last edited:
I looked at so much info over the weekend can't remember where I saw it! Want to find it for myself so will post it if my brain starts working again :)
 
here's another one for User and his long term systems... :)

the old sell in may and go away strat..


buying on the 1st trading day of October each year, covering then shorting on the last trading day in May.

approximately 17,000 points since the 1920s. when of course a Dow point would have been worth a hell of a lot more than it is in today's market...

profit factor of nearly 4 as well!

Total Points 16792.57
Trades 152
Wins 79
Win % 52.0%
Average Win 285.0
Average Loss -78.4
Profit Factor 3.9


funny how the simple things work best sometimes..

FC
 
FetteredChinos said:
here's another one for User and his long term systems... :)

the old sell in may and go away strat..


buying on the 1st trading day of October each year, covering then shorting on the last trading day in May.

approximately 17,000 points since the 1920s. when of course a Dow point would have been worth a hell of a lot more than it is in today's market...

profit factor of nearly 4 as well!

Total Points 16792.57
Trades 152
Wins 79
Win % 52.0%
Average Win 285.0
Average Loss -78.4
Profit Factor 3.9


funny how the simple things work best sometimes..

FC
Priceless FC, just the sort of strat to be running from an exotic beach somewhere where the waters warm and the drinks are cold and chaep. Mmmmnnnnnn
 
i should add, that since 1985, that strat has yielded 15,705 points from 40 trades, 27 wins...

the equity curve has gone nearly parabolic in that time..

where it continues in the same vein is debatable..

fc
 
FC,

Forgive me for being tedious but what do the stats show from 1999 through to 2005.

Thank you.
 
erm 9654 points from 12 trades, 9 wins... :eek: from Jan 99 to Oct 04

bonkers.. ive had a look at the coding, and it seems ok. im only using EOD data, so there shouldnt be too much of a data issue.....
 
Top