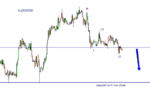
I’m sure when I’m as experienced as you Beginner Joe I’ll use similar terms, but if only for my benefit right now, what do you mean ‘pattern on unbalanced liquidity weighted on the short side’? All I see is a weakening euro and/or a strengthening yen. Liquidity today (bank holiday) and at this time of day when it is generally quiet was expected to be light and evidenced by a smaller than average range compared with a ‘normal’ day. What we have experienced today is fairly normal ranges and therefore liquidity in this pair. Liquidity is either there or not and in the forex market is typically there during the prime London session and typically not outside of that. ‘Unbalanced liquidity’ in a downward moving eurjpy would suggest either a lack of appetite to sell euro OR a lack of appetite to buy yen thus negating the and/or I proposed above. If you have an inside track on this unbalanced liquidity as it stands right now for this pair can you tell us which it is, and why, and how we can use that information with regard to subsequent price development? I’d also appreciate how you access this information. Thanks.