leovirgo
Senior member
- Messages
- 3,161
- Likes
- 156
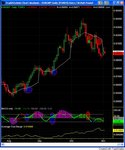
VE on EURGBP daily
This is Vwap Engine in its simplest form, i.e, on a daily chart. Use MDM and daily MACCI cycles to take directional trades. This is the strategic direction and the rules were already given in previous posts.
Once I've got that, I use the box mechanism, as shown in above post, for precise entry. There is no holy grail method but the holy grail for money management.