Best Thread Vwap Engine

1st June 2009

I have completed Vwap Engine's top infrastructure. During my weekend review, I find that I was more occupied with lower level structure and overlooked higher TF line ups. So whatever it is called, a system, a methodology, or an engine, it is almost done. I need a strong engine as it has to last a long time be it in range bound or panic or efficient markets.
 
Top level conditions for VE

Here is the list of rules for Buying a trend, reverse for shortsell.

It must be applied top down, so if we have condition 1 for long, 2,3,4 etc must have long conditions and 3&4 alone cannot be used unless 1 and 2 are there. 5&6 can be adapted to any intraday TF to suit one's trading personality.

Day
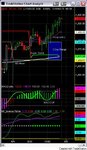
1. Daily Chart: Check MACCI/IF cycle
if they are OS+ or UP, look to go long. Aim is to ride it until it is overbought.

2. Daily close above MD mean (this is the cumulative daily mean, starting from beginning of the month, say today is 5th June, then it calculates mean from Day1 to Day5 of month.) This is my key concept, a trend begins from the mean, after mean reversion from opposite end. Once it is above MD Mean, it has potential to fly/trend.

Hourly
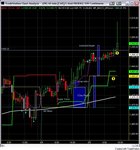
3. Above last 3days' mean range (not actual high low, but the range for intraday means)
I do this on Hourly chart.

4. Above SuperTrend in Hourly chart.

3&4 make sure that it is already on launch pad.
Once 1,2,3 &4 are in place, it is ready to fly. It just needs fuel based on market sentiments.

EntryLevel TF (ETF)
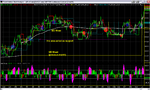
5. Intraday Set up must be Strong Day set up- basically today price is higher than yMean(yesterday's mean)

6. Above VWAP in ETF up cycle.

5,6 actually limit the downside, with hardstop placed below yMean.

In earlier posts, I talked about 3 set ups for VE. Now I use them in the context of this approach. Any set up outside this framework may be traded for short-term only - with targets at previous SR lines, or exit on multi-TF MACCI exhaustion. If I have time I will post some examples. The thing is, this framework works on futures, commodities and even currencies. Any questions please feel free to ask me. cheers!
 
Here is an illustration for summary points in the previous post.

This chart is ES for May 2009. It is not a trending month based on this Top level framework. Even then there are some good moves. The good thing is, I don't need to draw the lines myself. VE does the job for me. :)
( p.s, its a large image.)
 

Attachments

  • 2009 May ES.PNG
    2009 May ES.PNG
    92.3 KB · Views: 188
excellent post re: set-ups. what is "yMean"?

interesting idea about this mean value starting from first of month. so the value can be choppy to start with, because it has few data points but as the month wears on, the value smooths, as their are more data points, thus reducing the impact a new data point? ie, the value of day6 added will have a larger impact on the mean of 5 days, than the same value if added to the mean of 25 days?

what rule-sets do you have for position sizing and risk control?

are you experiencing a good return on investment?

yMean = yesterday's mean at the close

Regarding MD mean, it is cumulative, i.e, it is calculated as (total sum/ total periods = 1+2+3+4+5+6/6), therefore Day6 data has only limited effect (1/6) and Day 7 has 1/7 share and so on- as periods increase their share in the mean decreases.

Re position size, I use 10min size, so it is rather small stop but I tend to set b/e as soon as I can to reduce drawdowns. As a result, it can be rewarding after a trend trade. I am only starting out so it needs time to smooth the curve. You'll see results on this board. cheers..
 
VE analysis premarket , June 3

Indices have broken through MD Mean to the down side. But it is still within 3day range with support at 8504(YM), 920 (ES) and 1434(NQ). Can sell toward those supports.

INDU Cash Daily cycle is still UP, therefore, any pullback may be good to long again, at least to form a lower high.

In summary, bearish for immediate direction, but will go long when it reverses.
 
Last edited:
There were "range short" entries yesterday- with ES just 3 pts shy from 920 support. And, of course they all went up again, as forecasted in previous post. Now they all are above MD Mean. But the range is getting smaller, so we are closer to getting a swing trade. It will not be a long trade unless INDU cash break above 8750.

I didn't take any live trade yesterday due to two conflicting major factors:

1. INDU Cash was still bullish - no shortselling (for swing trades)
2. Market Internals were heavily bearish - no buying

For these two reasons, it did have a V shape day. In future, I will give it a go with small risk, small reward money management. It was a pain to sit and watch it unfold just as the way I had already expected. Anyway, that was a valid decision to stand aside.

So, plan for today is,
1. To short it for a swing position once it broke below MD Mean and support level
YM- 8661/8636
ES- 936/929.56
NQ- 1468/1468

2.To go long, above MD Mean, from vwap, IF INDU Cash 60 cycle is UP.
Target levels are
YM- 8722
ES- 943/939
NQ- No limit, can be a swing through 1495/1500
 
It was a pain to sit and watch it unfold just as the way I had already expected. Anyway, that was a valid decision to stand aside.

Would it not be worse to have it not do as you had expected ? Your analysis was correct and that is all that matters in my view. There will always be more opportunities in the future and it is great that you are documenting your progress on this thread.


Paul
 
Leo, just to confirm, MD Mean is the monthly vwap (from start of the month)?

Yes it is. You'll see that NQ is in trending mode and YM just trying to catch up. The only point to consider is that they all are o/b in daily chart.
 
NQ breaking out

This is NQ within VE's top level framework. It has support from various sources hence demand picked up and it moved up even further.
 

Attachments

  • Trend Break Out- NQ 090604.jpg
    Trend Break Out- NQ 090604.jpg
    61.9 KB · Views: 173
VE has identified good swing trades but still need good procedure to maximise the profit. Therefore, I have started a new thread in General section about how to trail profit for VE trend trades with a real example. The position will be managed on that thread. I am doing it away from this thread to get more reaction from other members who may use other methods.

http://www.trade2win.com/boards/general-trading-chat/63680-where-do-i-take-profits-long-trade.html

Once I have firm idea about how to exit trend trades, then I will summarise it here on this thread. Then we will have a complete methodology.
 
2.To go long, above MD Mean, from vwap, IF INDU Cash 60 cycle is UP.
Target levels are
YM- 8722
ES- 943/939
NQ- No limit, can be a swing through 1495/1500

This move has been expected in VE analysis while the traders and analysts alike were calling the top of the market. Entry was 1482 (as shown in yesterday's post). The position has been stopped out at 1498. Run up was as high as 1513. Actually it is part of a bigger trend trade that started on 29th May with an entry at 1420 netting 78pts.

Lesson learnt: A technical trader must follow what it is on the chart, ignore the sentiments and commentaries and take profits/losses as they come.

I will continue to call the trades on this thread. Lets rock!!!!!

Attached is the updated chart for NQ.
 

Attachments

  • Trend Target NQ 090605.jpg
    Trend Target NQ 090605.jpg
    87.1 KB · Views: 172
Last edited:
Just entered a small long on INDU Cash just below vwap (8780, ym futs) as it is still in trend mode. Stop at 8752.
 
Last edited:
June 8th Monday

INDU Cash is still in bulls territory but it may change today. Futures are boxed inside the range, near MDMean. So I don't see any swing opportunities unless they break out. In terms of VE tactical set up, they are all setp up for a reversal UP cycle. But the 3Day range loos like it is setting up for a further down move. So, I will try to scalp if RR is good or wait until a better set up is in place. The best move so far is in Silver- a beautiful shortsell that happened early in the morning around 6.30-7am.
 
Tried to sell short NQ twice. First one was out at break even after some nice run-up profits. It didn't break out to lower target. Second one was stopped out with -5.75pts(NQ). Internals were bearish and I must sellshort as per system but 1468 support was solid. I knew 60 cycle was oversold but bearish internals favoured a sell. Plain old cycle buy was there for a swift move north.
 
June 9th
YM and NQ are now on the launch pad and bullish but need to be cautious as Daily is way overbought. Well, there is a trend until the turn, isn't it?
 
Did actually went long NQ for 6 times today - four times it came back to break even entry, one loss and one good exit. IF I had taken +5pts each at (1500 area) Resistance in the first four trade, it could have been +20 as it was very congested in the first hour of trading. Don't like the way it is struggling to move up, this also applies to ES.
 
10th June
I was kicking myself for not carrying the long trade overnight as NQ hit 1517 target during the pre-market session. Then it dropped like a stone to 1488(as of now) then I thought it would have touched my trailing stop at 1498. I feel good about taking profits yesterday but this is more like luck rather than rules-based outcome. I can still make it even better with rules. Now I am standing aside as I don't have clear direction yet.

Conclusion: With strict rules, I can simplify the entry. I can also carry Trend trades overnight and get the target hit. Target and trail mechanism is working well. I will post the charts when I can.
 
Top