volume spread analysis (VSA)

petervt

Newbie
Messages
1
Likes
0
volume spread analysis

Hello

Has anyone had any experience with volume spread analysis and the vsa software?
The have a new software which replaced vsa and is called tradeguider by Tom Williams, it claims to show where the professional large trading syndicates are buying into or selling the market, showing strength or weakness at tops and bottoms.
Any feedback will be appreciated, as I am looking to buy this program.

Thanks

petervt
 
What is (or might be) Volume Spread Analysis?

Or is it just a Commercial Trading System name?

A quick google didn't throw up any non-commercial links.

BTW - The VSA bunch have an interesting website address...
 
Brambles

TheBramble said:
What is (or might be) Volume Spread Analysis?

Or is it just a Commercial Trading System name?

A quick google didn't throw up any non-commercial links.

BTW - The VSA bunch have an interesting website address...


Sometimes referred to as "Tape Analysis" which leads to confusion. Try a search on "Google" under "tape reading" and :

Look at this thread for a Volume/Price discussion;

http://www.elitetrader.com/vb/showthread.php?threadid=29005

( The Elite Trader thread starts off as a little esortoric ramble but soon gets down to volume and price analysis).

Hope the above helps.

:D
 
I have used the old VSA5/7 (EOD version) in 2000. Quite a good concept I thought, but one thing bothered me at the time. The software would produce red or green arrows to indicate signs of weakness/strength, and green or red bars (plus other indicators which I didn't use). However, these arrows would frequently "disappear" with the next bar when the move was not in it's favour, and the previous bar would also change colour from green to red or vice versa. The result was that when you looked at a historical chart retrospectively, the signals looked absolutely great, and they received good reviews at the time in the press (I dont think they studied it thoroughly as they didn't pick up this problem), but then a lot of arrows had conveniently disappeared. I tackled Tom Williams about this, and it was put down to a 'bug' in the software.

These comments relate to the older software, and hopefully the more recent Tradeguider shows none of these old characteristics.

rog1111
 
Rog, disappearing signals remind me of one of my earliest forays into the market when I thought I had discovered the Holy Grail in MetaStock's 'ZigZag' indicator.

Not only did I actually trade this, I also did the very enthusiastic newbie thing of making my stock picks widely known to all around (just verbally, long before the advent of t2w).

To suddenly discover (after what must have been months of never-to-be-repeated good luck) all my open trades showed that I should have been in exactly the opposite direction to my current positions - all of them.

I reversed them.

You guessed it.

Next day - good old ZigZag switched back.

I thought I'd better read up on how ZigZag was implemented.

My first real major feeling of sickness and stupidity that I suspect is a part of the education process for many (most?) early traders.

Apologies for the digression and thanks to all for VSA links.
 
rog1111 said:
I have used the old VSA5/7 (EOD version) in 2000. Quite a good concept I thought, but one thing bothered me at the time. The software would produce red or green arrows to indicate signs of weakness/strength, and green or red bars (plus other indicators which I didn't use). However, these arrows would frequently "disappear" with the next bar when the move was not in it's favour, and the previous bar would also change colour from green to red or vice versa.
rog1111

I don't know which way the current Tradeguider software deals with this problem. Some developers allow accumulating evidence about the current bar to trigger a provisional signal, which is then withdrawn if the numbers do not support that signal after the period has finished. I am currently working with a piece of code which generates a signal that the current bar is, say, a "bullish inside bar" but will withdraw that signal if the price ranges outside the limits of the previous bar. The other way of doing things is to fix your software so that it never delivers a signal until the relevant time period has closed, in which case there is no hint of hindsight in the shape of "revisions" to the chart. But this option - which is the policy adopted by CQG, for instance - can be very irritating if all signals are delivered 5 or 15 minutes late (and particularly if the chart then stamps them as belonging to the bar before they were actually delivered).
I don't think either approach should necessarily be regarded as duplicitous, because each can be misleading when viewed after the event. Personally, I slightly prefer a provisional signal to a correct signal that is backdated to 5 minutes before it was issued.
 
Tom's concepts are good in theory, but like most things hard to apply in practice........ they were trying to automate trading using VSA auto, but dont think it worked.

There are some useful concepts, but will need a lot of time put in to learn 9 if u do grasp it)-


Al
 
VSA/ Tradeguider

I see the new website has been launched (www.tradeguider.com) the: esignal version is now available (delayed for > 5 months!!)

don't know if the program has been improved.........but the website has!!

maybe the rescources have been applied to "marketing" rather than developing Tom's ideas..............too early to tell!

xs
 
Tradeguider

I bought the software and took their training courses. Software is full of bugs. Stuff shows up and dissappears. They are spending the money on advertising and not on fixing the code. They told us they were fixing the code and that a new version was coming out very soon. That was over 1 year ago and no up date has been done to fix the know problems. Also the software does not keep up with an active market. You need to refresh the chart every min or so. Pretty bad and I would recommend that you stay away. If anyone is interested and still wants to but it I will sell you mine for 1/2 price.
 
VSA/Tradeguider

redislk said:
I bought the software and took their training courses. Software is full of bugs. Stuff shows up and dissappears. They are spending the money on advertising and not on fixing the code. They told us they were fixing the code and that a new version was coming out very soon. That was over 1 year ago and no up date has been done to fix the know problems. Also the software does not keep up with an active market. You need to refresh the chart every min or so. Pretty bad and I would recommend that you stay away. If anyone is interested and still wants to but it I will sell you mine for 1/2 price.

My experience with this (when it was fresh on the market in the first half of 2004) was disappointing. The trouble with it was not so much with bugs, or failure to refresh in fast markets, as with the fact that the indicators provided on a Tradeguider chart were not consistent with each other and did not in any way address the old conundrum of trend vs. oscillation.

The "Volume Spread" elements of the package are essentially playing to a mean-reversion move, but suffer from the fault of all such indicators, that the signals can occur at moments which are no more than points of inflection in a trend away from the mean. To counteract this aspect, there are trend identifying elements, which paint the bars different colours according to whether the trend is up or down. (And there are also some further trend identifyers which re-affirm or contradict the bar-colouring algorithm). Finally, there is a notion of "trend clusters" which aims to diagnose icebergs of congestion, which the savvy trader should avoid.

The people who were (and are) marketing the product responded to complaints of inconsistency by saying that it was "not a buy/sell system", and also that the indicators on the chart were just "training wheels" that could be dropped when you had learnt how to trade without them (I kid you not).

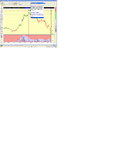
There was one particular day when the attached chart was generated. The VSA indicator draws our attention to the moment (11.40 EST) at the top of the rise from the open that had taken the market up 12 points? A red rectangle appears at the top of the chart. Volume had sparked up to 20,000 contracts in the preceding bar (up 1.25 pts). Good point for a sell signal, perhaps?

What does the commentary say? It says: "Upthrust after previous weakness". Let's have our upthrusts preceded by more weakness consisting of 12pt rises!

The point is not that this indication would be a bad signal. If taken as a signal, it could have been a good moment to short. But the underlying classification of the price/volume action is not smart. The best one can say is that it is insensitive to context, and asks the user to sort out the contextual factors (a characteristic of the comments on these information balloons). The expert knowledge should, rather, be providing expert guidance.

The fact is that this stuff is not useful, and therefore not worth the money, but can be used by skilful salesmen to spin a good yarn.
 

Attachments

  • Tradeguider 040714.PNG
    Tradeguider 040714.PNG
    754.5 KB · Views: 1,145
Last edited:
I think the concept is good, but the software doesn't seem to offer anything you can't figure out in your head. The indicators I find frequently to be misleading if not innaccurate.

They have even stated in a seminar that tom williams is so good at use of this type of analysis he doesn't need the software - which raises the question as to why anyone does.

The software is buggy, but not seriously so, adn I couldn't see a proble with chart updating fom real time feeds from esignal. However, I haven't figure it outv well enough to see how it can eb useful enough to make money.

One thing that disturbs me though is that investors chronicle gave it and vantagepoint top marks, yet I can't find anyone anywhere who can make money with these products. :(
 
Tom Williams

Crabbydog - try using the "upthrust" and short after a sustained rise. Use the top of the upthrust as a stop. Doesn't work all the time but then what does. It works for me. No- I don't use the software - just Toms ideas.
Investors chronicle - well one does wonder why their reviewers of software are not filthy rich considering all the holy grails they write about :cheesy:
 
Last edited:
Vsa

I have bought the tradeguider software and took a class. It was very educational and taught me more about tape reading than I had learned in 4 years of professionally trading stocks. The software is great for anyone looking to get more edge in the marketplace and wants to have an extra confirmation strategy for entry's into the market. I have used tradeguider for about a year now and am looking to move into real estate full time so anyone looking to use tradeguider can have mine for half price of what I paid for it.

DTR
 
downthatroad said:
I have used tradeguider for about a year now and am looking to move into real estate full time
DTR

perhaps not the most ringing endorsement I've ever heard?

:LOL:

UTB
 
Top