Vetex FX VTL Indicators & Scripts

CamarillaFlatAndClear VertexFX Indicator

The CamarillaFlatAndClear is an innovative VertexFX client-side indicator based on daily pivot and Camarilla levels.

Pivot levels are an useful tool to identify key support and resistance levels. However, they have outlived their purpose especially for short-term traders.
The CamirillaFlatAndClear indicator is an improvement of the pivot levels and Camarilla levels using "squares of 12" method.

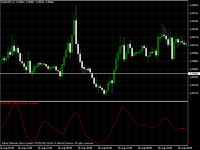
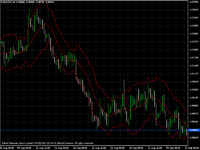
The indicator provides seven key levels - namely the central Pivot level (YELLOW), three support (RED) and resistance (GREEN) levels each. Unlike traditional pivot level trading methods, the levels provided by this indicator act as breakout levels. Short term traders prefer to trade in the direction of the level (breakout) rather than against it (reversal). When used with short-term Exponential Moving Average (EMA) it provides excellent breakout trades for short term traders.
The central pivot level (YELLOW) is the average of the previous Day's High, Low and Close. The other levels are calculated from "squares of 12" method, whereby the previous day's range is divided by 12, 6 and 2 respectively. The resistance (GREEN) levels signify resistance. However, when the price is trending upwards alongwith the EMA, these levels act as bullish breakout levels. The support (RED) levels signify support. When the price is trending downwards alongwith the EMA, these levels act as bearish breakout levels.

BUY / EXIT SHORT - Enter LONG (or exit SHORT) when the price crosses above the GREEN Camarilla levels from below and the price is above the Exponential Moving Average. The stop-loss can be placed below the nearest Swing Low. Traders should employ a trailing stop when the position is in profit.
SHORT / EXIT LONG - Enter SHORT (or exit LONG) when the price crosses below the RED Camarilla levels from above and the price is below the Exponential Moving Average. The stop-loss can be placed below the nearest Swing High. A trailing stop should be employed to ensure profitable positions are protected.
camarilla flat.png
 
Sadukey

Saukey is based on a complex mathematical signal processing algorithm to capture the trend changes at an early stage. It plots two lines on the chart, like moving averages. In comparison to moving average cross over strategies, the Sdaukey indicator reduces the lag factor significantly.

Trading signals with Sadukey indicator is simple. When the green line cross above red line, open long position. When red line cross below green line, go short. Stop loss can be placed below recent high or low. This is a good indicator to capture trend changes at an early stage, however in trading ranges, the signals may not be effective. This can be avoided with the help of other indicators. If a trading range is identified in chart, open trades on breakout of the trading range.

qfjgDt9.png
 
PCC

Percentage Channel, PCC is a modified version of the Donchain channel indicator. Instead of the N day High Low range used in Donchain channel, Percentage Channel uses a certain percentage value of the price to draw the channel. As price moves upward or downward, the PCC shows trading opportunities. It is a trend following indicator, and the signals make good profits on long lasting trends.

Price trade inside the channel for considerable period and then breakout from the channel. This is likely to be a new trend beginning. Traders can open buy position when price establishes above the upper channel line. Short position is opened when price trade below the lower channel. Trading activity inside the channel indicates lack of strength in the current trend. Usually in an up trend most of the trading happens inside the upper channel line and mid channel line. In down trend, price action is more likely to confined within the lower channel line and mid channel line.

y0bxhO8.png


PCC is used in long time frame charts like daily or weekly charts. The default value for parameter percentage in PCC is 2. Test the channel with different values for parameter percent and use the best parameter value for each instrument. The best value for percent depends on the volatility of the instrument. PCC avoids many false signals that occur with other channel indicators in tight trading ranges by choosing a proper value for parameter percent.
 

Attachments

  • PCC.zip
    1.8 KB · Views: 184
Last edited:
Volatility Bands

Volatility Bands is based on the concept of Bollinger Bands. The difference is that volatility is used as the bands instead of standard deviation. It allows users to compare volatility and relative price levels over a period time. The indicator consists of three bands designed to encompass most of the security's price action. Volatility Bands are plotted at volatility levels above and below a moving average. A distinct characteristic of Volatility Bands is how the spacing between bands varies based on the volatility of prices.
5i5cj4p.png

Like Bollinger Bands, the bands are self-adjusting: widening during volatile markets and contracting during calmer or trending periods. Volatility bands can help confirm trend, but they do not determine the future direction of a security.
In an uptrend when price reaches the lower band buy position can be opened. In down trend, when price reach the band top sell is recommended.
 

Attachments

  • Volatility Bands.zip
    2.2 KB · Views: 191
Trendless Oscillator

Trendless Oscillator was developed by Joe DiNapoli and described in his book, Trading with DiNapoli levels. It used with Fibonacci Levels to open trades. However, it can be used as a standalone indicator or with other indicators and support resistance levels.
Formula
TrendlessOscillator = Close – Simple Moving Average of close with period 7

273257


The basic idea of the Trendless Oscillator is when it is above 0, it is uptrend and when below 0, it is down trend. It is designed to show overbought oversold situations too. When it reaches an extreme level above 0, the instrument is considered in an overbought situation. This may lead to consolidation or trend reversal. Many times, trend pauses and continue in the original direction. The overbought levels are used as profit booking levels. The extreme levels in this indicator is a relative term, observe the charts and find the extreme levels indicator reached historically. This depends on the volatility of the instrument.
Another method to use the oscillator is divergence. When price makes new high and oscillator fails to reach new high, there is divergence between price and oscillator. This happens when the trend is losing strength, and eventually lead to a reversal of trend.
 
Trend RSI

Trend RSI is a modified version of the classic RSI indicator. It smooths the price with a moving average before calculating the RSI. Then it applies a factor of ATR in smoothing out the RSI values. The plots are like classical RSI indicator. The yellow line is the Trend RSI value and the dotted line is the signal line. Trend RSI can be used as the normal RSI indicator. The difference is trend RSI indicator removes many whipsaw signals associated with the RSI.

Trend RSI value above 80 is considered as overbought and value below 20 is considered as oversold conditions in the instrument. Some traders use 70 30 levels. In a consolidation, the overbought oversold levels signal reversal. In strong trends, overbought oversold levels mean a temporary pause in the trend before continuation.

trend1.png


Some traders use Cross over between Trend RSI and its signal line can be used as signals. When a cross down happens sell positions can be opened. When up crossover happens buy positions can be opened. However, trades taken in the long term trend direction works best with this strategy. Another method is the divergence between price and Trend RSI. When price makes new lows, but Trend RSI fails to make new lows, buying is suggested. Price makes new highs, but Trend RSI fails to make new highs, selling is suggested. When divergence happens, it more likely that the prevailing trend will reverse direction.

Parameters:

RSIPeriod – RSI Period
EMAPeriod – Smoothing MA Period for Price
ATRPeriod – ATR Period
K – Smoothing Factor
 

Attachments

  • TrendRSI.zip
    2.3 KB · Views: 185
Parabolic Stop and Reverse Auto trader

The parabolic S A R auto trader uses two Parabolic Stop and Reverse indicators with different parameters for opening and closing trades. The first PSAR is used for opening positions and a faster PSAR is used for closing positions. This will book the profit quickly before the longer trend reverses. When the price closes above both PSARs, a buy position is opened. And when the price closes below the second PSAR, the position is closed. Opposite conditions are used for opening Sell Position. The PSAR auto trader applies a stop loss based on ATR, and a trailing stoploss.

img.png
 

Attachments

  • PZ Parabolic SAR EA.zip
    4.8 KB · Views: 135
Last edited:
Volatility Pivots

Volatility Pivots is a trend following indicator. The indicator is calculated based on currency pair volatility displaying the nearest support and resistance levels. It uses the average true range and the exponential moving average of price in calculating support resistance levels. Then it plots these levels as a line on the chart. When the price is above the pivot line, it indicates an uptrend, and the price action below the pivot line indicates a down trend. Positions can be opened in the direction of the trend.
img.png
 

Attachments

  • Volatility Pivots.zip
    2 KB · Views: 130
Reversal Trend Following


The Reversal Trend following Autotrader is an always in the market trend following strategy. This is a 100 bar high low breakout strategy. Trend following systems uses different strategies like breakout, moving averages. Usually, trend-following systems are applied to a portfolio containing different asset classes. The aim is to capture some big trends and profit from them. The downside is it makes small losing trades many times and profits from big trends. It is important to use such systems in a diversified portfolio.

This system is run on daily charts. The system exits sell positions and open buy position when price break above 100 days high and exit buy position and open a sell position when price break below 100 days low. Positions are opened after a breakout is confirmed. For a buy, First bar close above last 100 day high, then next bar close above the high of the breakout bar. At the next bar open the Autotrader buys. Money management is an important factor in using trend following systems because they remain in drawdown for longer periods. Use this system on multiple symbols at the same time and divide a small part of the capital for a symbol. Never use full capital among all symbols. The portfolio might contain noncorrelated assets including index futures, bullion, currency pairs, etc.

img.png
 

Attachments

  • Reversal Trend Following.zip
    2.4 KB · Views: 132

Close Bollinger Bands Crossover​


Close Bollinger bands crossover is a client-side VTL indicator. This indicator is based on Bollinger bands. The idea behind Bollinger bands is when the price is above the upper band, it is too high, and a mean reversion is expected. This indicator marks a red down arrow when the price closes above the upper Bollinger band. When the price close inside the Bollinger bands after closing above the upper band, it plots a green up arrow.

This indicator is useful in short-term mean reversion trading. When the red arrow appears, consider opening a short trade and then cover the short trade when the price closes inside the band. However, in strong trends, this may fail. It is better to use these signals in rangebound market conditions.

Parameters:

  • Period – The Bollinger band period, default is 20
  • Deviation – The standard deviations for bands, default is 2
  • Shift – Bar shift, default is 0
closeBB.png

The basic assumption of Bollinger bands is price will remain inside the band most of the time, when price moves beyond the band, it will immediately come back inside the band. However, in strong trends, prices remain outside the band for longer periods before reverting inside the band. Identifying the overall market conditions before using the signals to open trades is important. In rangebound market conditions, these signals work better.
 

Attachments

  • CloseBBCrossover.zip
    1.9 KB · Views: 42
The elegant oscillator is client side VTL indicator. It is based on signal processing algorithms and used in mean reverting trading systems. Mean Reversion theory suggests that after an extreme price move, asset prices tend to return back to normal or average levels. Prices routinely oscillate around the mean or average price but tend to return to that same average price over and over. Mean reversion strategies open trades when price moves to extreme levels, expecting price to return to the historical mean price. This is a counter trend trading strategy.

The elegant oscillator helps in identifying extreme price levels. Elegant Oscillator is a technical indicator based on signal processing techniques. It calculates the inverse Fisher transform of price and applies the smoothing filter to it. The resulting line oscillates between the values -1.0 and +1.0. Find out the extreme levels it reached in the historical chart and open a counter trend trade when it reaches around the historical extreme levels. It is better to be used with other indicators to confirm the signals.

Parameters:

Band Edge – Parameter to calculate the band edge, default is 20

Oscillator Period - Number of bars in the indicator calculations, default is 50

Price - Price field to calculate the indicator. 1 Close, 2 Open, 3 High, 4 Low, 5 Median, 6 Typical, 7 Weighted


Test the indicator on charts with different parameter values and pick the best parameter values for each instrument before using it in trading.
 

Attachments

  • elegant.png
    elegant.png
    31.7 KB · Views: 51
  • Elegant Oscillator.zip
    2.4 KB · Views: 41
Momentum Deviation bands - VertexFX
Momentum deviation bands is a client side VTL indicator. It is similar to Bollinger bands. Bollinger bands use standard deviation of price in band calculation. Momentum deviation bands use momentum of price instead of standard deviation. It is used in the same way as Bollinger bands.

Momentum deviation bands identify oversold overbought conditions in the asset price. It can be used to create mean reversion strategies as well as trend breakout strategies. A close above the upper band suggests a trend breakout. When price goes too far away from the upper band, it suggests an overbought situation and mean reversion strategies can be applied.

When the band width is relatively small and it suddenly expands, it suggests a new trend development. Trades should be confirmed with other non corelated indicators. For example, when a upward breakout is identified by the momentum deviation bands, look for confirmation with some volume based indicator.

Parameters:

Period - Number of bars to calculate the bands

Multiplier -A multiplication factor, similar to standard deviation in Bollinger bands

MomPeriod -Momentum calculation period

MomPrice -Price field for calculations, 1 Close, 2 Open, 3 High, 4 Low, 5 Median, 6 Typical, 7 Weighted
 

Attachments

  • MomentumDeviationBands.zip
    2.5 KB · Views: 38
  • momentum.png
    momentum.png
    36.7 KB · Views: 52
Bullish Reversal Autotrader

Bullish Reversal is a long only client side VTL auto trader. This is a bullish candlestick reversal pattern-based auto trader. The following bullish patterns are identified and when the pattern completes, the autotrader open buy position. All these candlestick patterns involve three candles.

Abandoned Baby. The candlestick pattern is formed when:

  • The first bar is a large down candlestick located within a defined downtrend.
  • The second bar is a doji candle (open is approximately equal to the close) that gaps below the close of the first bar.
  • The third bar is a large white candle that opens above the second bar.
Morning Doji Star. The candlestick pattern is formed when:

  • First candle is in a downtrend and have a black body
  • Second candle is doji and the doji body is below the previous candle body
  • Third candle is white body and candle body above the previous candle body
Three Inside Up. The candlestick pattern is formed when:

  1. The market is in a downtrend or a move lower.
  2. The first candle is a black (down) candle with a large real body.
  3. The second candle is a white (up) candle with a small real body that opens and closes within the real body of the first candle.
  4. The third candle is a white (up) candle that closes above the close of the second candle.
Three Outside Up. The candlestick pattern is formed when:

  1. The market is in a downtrend.
  2. The first candle is bearish.
  3. The second candle is bullish with a long real body and fully contains the first candle.
  4. The third candle is bullish with a higher close than the second candle.
Three White Soldiers. The candlestick pattern is formed when:

  • The first candle seems like the continuation of the downtrend. It is a bullish candlestick meaning the closing price should be more than the opening price and indicates that the bulls are back into the action.
  • The second candlestick should also be bullish. The opening price should be within the real body of the first candlestick most preferably between the midpoint and closing price of the previous candlestick. The closing price should be above the previous candle’s closing price and should be higher than the previous candle’s closing price.
  • The third candlestick should also be a bullish candlestick having no or small shadow. The opening price should be within the real body of the second candlestick most preferably between the midpoint and closing price of the second candlestick. The closing price should be above the previous candle’s closing price and should be higher than the previous candle’s closing price.
The trading system entry rules are:

  • A bullish candlestick reversal pattern is formed (The 5 patterns listed above).
  • The price is below 50 period exponential moving average.
  • Open a buy position on next candle start.
The exit rules are:

  • Exit when stop loss of target is hit.
  • Exit when the trailing stoploss is hit.
The stoploss, take profit, and trailing stoploss is configured with the parameters of the autotrader. By default it apply a trailing stoploss only.

The autotrader works better on higher time frame charts like daily, weekly, etc. Test it on different timeframes before using it.

Bullish Reversal.JPG
 

Attachments

  • Bullish Reversal AutoTrader.zip
    3.1 KB · Views: 40
For scalper trades this should do the trick.
 

Attachments

  • Screenshot 2023-08-22 16.54.37.png
    Screenshot 2023-08-22 16.54.37.png
    57.3 KB · Views: 11
Top