Vetex FX VTL Indicators & Scripts

edakad

Active member
Messages
121
Likes
1
I have converted some indicators to Vertex FX trading platform. The VTL language scripts are attached. Hope this is useful to Vertex FX platform users.

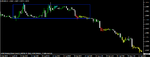
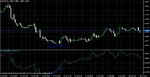
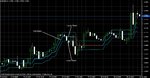
Zerolag MACD, Keltner Cloud and TSI

You can find more at http://vertexfx.net/plugins.html
 

Attachments

  • VTLscripts.zip
    4.5 KB · Views: 609
Last edited:
Three more Vertex FX VTL scripts

PTSP CCI

ADX EA

Triple MA crossover EA
 

Attachments

  • Local VTL Scripts.zip
    8.4 KB · Views: 466
PTSP CCI Alert - VertexFX VTL Script

Hello,

This is a CCI alerts Indicator of the VertexFX trading platform. The CCI can be used to identify a new trend or warn of extreme conditions. The VTL pop up alerts on the chart at critical CCI levels and plays a sound. The indicator plots green and red vertical bars in the indicator pane where critical alerts triggered. The red bar in indicator pane means an extreme level has reached for the up trend and green bar indicates an extreme level of down trend was reached.

Read more

Regards
Edit/Delete Message
 

Attachments

  • PTSP_CCI.zip
    3.4 KB · Views: 470
Triple EMA Corssover EA - VetrexFX VTL script

Hello,

This is converted version of mq4 EA based on EMA cross over. The three EMAs are short term EMA, medium term EMA and long term EMA. When the short term EMA is above medium term EMA and medium term EMA is above long term EMA, the EA opens a buy position. When the short term EMA is below medium term EMA and medium Term EMA is below long term EMA, the EA opens a sell position. When the EMAs are not in buy mode or sell mode the EA close the position.

More...

Regards
Edit/Delete Message
 

Attachments

  • TrippleMACrossOver_EA.zip
    1.8 KB · Views: 483
ADX EA - Vertex FX VTL script

Hello,

This is an mql EA converted to VTL script for Vertex FX platform.

The ADX EA is an Average Directional Movement Index based trading system.

The rules of the EA are:

1. Buy when +DI cross above - DI or +DI cross above ADX.

2. Sell when -DI cross above +DI or -DI cross Above ADX.

More...

Hope this is useful to VertexFX platform based traders

Regards
Edit/Delete Message
 

Attachments

  • ADX_EA.zip
    3.2 KB · Views: 434
VertexFx Indicator - Smooth Candle

Hi

I have converted the smooth candle indicator to VertexFX VTL script. VtertexFX users may find it useful.

Smooth Candle Indicator smooth out the candles with moving average of Open, High, Low, Close. This indicator can be used with other filters to confirm trend or can be used as a filter to existing systems.

Find out more
 

Attachments

  • SmoothCandleIndicator (2).zip
    1.3 KB · Views: 429
VertexFx Indicator - i4-GoldenLion Trend

Hello,

I have converted the indicator from mql to VTL script for VertexFX trader. This is useful to VertexFX terminal users

The i4-GoldenLion Trend Indicator marks candle in 4 different colors based on trend strength.

Blue : Strong uptrend. This may be a forewarning to trend reversal is imminent.
Cyan : Medium strength uptrend
Red : Strong down trend. This may be a forewarning to trend reversal is imminent.
Yellow : medium strength down trend The trend strength is calculated with Bolinger bands.

Find out more
 
I have checked out your chart with the indicator on it and first impressions look good.

I then look at it for blue candles - (stong uptrend) and the red candles - (strong downtrend) and see they appear at retracement levels - hardly that good surely?

Maybe they can give traders some guide - but I would also think they could get newer traders into wrong directions.

Can you show some more examples - with prices not in a range ???
 
Last edited:
Davies,

here is an image of down trend after a trading rage. after the breakout from trading range, the red bars, rather than a reversal warning worked as confirmation of downtrend to follow.
 

Attachments

  • i4.png
    i4.png
    11.2 KB · Views: 1,183
Davies,

here is an image of down trend after a trading rage. after the breakout from trading range, the red bars, rather than a reversal warning worked as confirmation of downtrend to follow.

Thank you

4 colours ? - what about the white candles as well ?
 
Kairi Indicator - VertexFX VTL Script

Hello

I have converted the Kairi indicator to VertexFX VTL Script. Hope this is useful to VertesFX terminal Users.

Kairi Indicator is an oscillator like RSI showing overbought/oversold market condition. The indicator oscillates with 0 as midpoint. The Kairi indicator is calculated as the deviation of current price from its moving average.


more....
 

Attachments

  • Kairi-indicator.zip
    2.2 KB · Views: 434
  • Kairi2.jpg
    Kairi2.jpg
    404.1 KB · Views: 1,207
Hello

I have converted the Kairi indicator to VertexFX VTL Script. Hope this is useful to VertesFX terminal Users.

Kairi Indicator is an oscillator like RSI showing overbought/oversold market condition. The indicator oscillates with 0 as midpoint. The Kairi indicator is calculated as the deviation of current price from its moving average.


more....

Good work . . . hope it will be helpful for others who trade on VertexFx platform.
 
Ozymanidas Indicator - VertesFx VTL Script

Hello

I have converted the Ozymandias indicator to VertexFX VTL Script. Hope this is useful to VertesFX terminal Users.

The Ozymandias indicator is a trend following indicator. It consists of a middle line and an upper band and lower band. In uptrend the middle line is blue and in downtrend the middle line is red. The bands can be used as overbought/oversold levels.


More.......
 

Attachments

  • ozy.jpg
    ozy.jpg
    246.1 KB · Views: 1,107
X-Points Indicator VTL Client Script

Hello,

The Xpoints indicator marks the reversal candles with blue and red arrows. The signals can be traded as a system or in use with other strategies as an advanced warning signal for trend reversal.

Hope this is useful to VertexFX terminal users.

More......

More......

7oC05ow.jpg
 

Attachments

  • xpoints-indicator.zip
    3.2 KB · Views: 257
Volatility Channel Stop and Fiji BB Alert - VertexFX VTL Script

Hello,

I have converted the Volatility Channel Stop indicator from MQL to VertexFX VTL. Hope this is useful to VertexFX platform users. Volatility Channel Stop is a stop and reverse type indicator. It draws a stop and reverse line, when the line is blue, market is in a up trend and the line is red, market is in a down trend. The red circle marks the trend reversal point for down trend and blue circle is the point at which trend reversed upward.

More...

25ztnoz.jpg
 

Attachments

  • Volty-channel-stop-indicator.zip
    4 KB · Views: 292
Fiji BB Alert - VertexFX VTL Script

Hello,
Hello,

I have converted the Fiji BB Alert indicator from MQL to VertexFX VTL. Fiji Bollinger Bands Alerts is a bollinger bands based VTL Client side script. It plots bollinger bands on the chart and also red and yellow arrows where divergence between price and bollinger bands is picked by the indicator. Divergence are forewarning to trend reversal. Red arrows are plotted when there is a divergence between price and upper bollinger band, it indicates weakness in uptrend and trend reversal. Similarly the yellow arrows indicate weakness in downtrend and probability of upward move emerging.

More.....

2r2ptlk.png
 

Attachments

  • fiji-bb-alert.zip
    3.1 KB · Views: 258
ATR Trailer EA VertexFX

Hello,

I have converted the ATR Trailer Expert Adviser to VertexFX client side VTL Script.

ATR Trailer is a client side VTL Expert Adviser. The EA opens a position when the EA is started on VertexFX client terminal. It then applies a stop loss based on ATR and ATR multiplier (default 3).

The stop loss is calculated as (entry price - ATR * ATR multiplier). Then as the trade progress, the stop loss is trailed, subtracting ATR stop loss from the maximum favorable level the price has reached. This continues until the stop loss is hit. When stop loss is hit, the EA opens new trade in the opposite direction to the closed trade, and ATR trailing stop loss is applied until stop loss is hit.

Hope this is useful to VertexFX terminal users.

More.......

9s4is1.jpg
 
Advanced ADX Indicator VertexFX

Hello,

I have converted the Advanced ADX Indicator to VertexFX client side VTL Script.

Advanced ADX Indicator is a VTL client side script that provides better visual representation on ADX indicator. In traditional ADX Indicator, ADX indicates the trend strength and plus directional index (+DI) and minus directional index (-DI) determines the trend direction.

When plus +DI is above -DI, trend direction is up and when -DI is above +DI, trend direction is down. The bottom pane in chart is normal ADX indicator. The dotted lines represent +DI and -DI and continuous green line represents ADX.

Advanced ADX indicator is plotted in the middle pane. ADX values are plotted as a histogram. When trend direction is up (+DI above -DI), the histogram color is green and when trend direction is down (-DI above +DI), histogram color is red. Thus green histogram represents up trend and red histogram represents down trend and trend strength is indicated by the histogram height. This provides an easy visualization and interpretation of ADX.

ADX period can be customized with the parameter "ADXPeriod" in VTL script. Default value is 14 but users can change it to arrive at better period values.

http://www.hybrid-solutions.com/plugins/client-vtl-plugins/free/advanced-adx-indicator.html

k4tsa9.jpg
 
Top