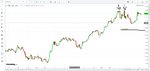
The weekly chart below shows how the overall bias is bearish with price reversing at monthly and weekly key levels as well as a reversal at the weekly fibb zone followed by bearish momentum. After a few weeks of failing to break above monthly resistance 1.2800, last week broke above it with a bullish MA wick rejection as well as an MA crossover, this means there is a high probability of price rallying up to the weekly resistance 1.3100, before continuing its bearish momentum.
You are using an out of date browser. It may not display this or other websites correctly.
You should upgrade or use an alternative browser.
You should upgrade or use an alternative browser.
I hold a bearish position for the USDCAD and look forward to his return to the region of C $ 1.2720.
The Bank of Canada continues to take a cautious stance, promising an increase in the rates of "over time". In good condition, an average of 0.07% in April and 0.27% by July). I am waiting for the fall of the US-Canada bonds and the USDCAD decline in this medium term.
The bullish momentum is weakening, and the DMI indicators confirm a probable change of trend. Within the last wave of growth, the pair rested on the most important resistance C$1.2950 and could not break above. On the 4-hour chart, a double top was formed, the technical realization of which is the area C$1.2720.
Attachments
USDCAD and the Volatility Response Model (VRM)
I am using the Volatility Response Model (VRM) to follow the USDCAD and EURCAD which you can find described in the first post of the thread tade2win of the Forex forum
"Predicting future FX support and resistance levels using mathematics"
Normally this thread presents predictions and then results for GBPUSD each day and occasionally EURGBP and EURUSD.
You can find USDCAD and EURCAD predictions each day on the website
https://www.complexhamiltoniansystems.com/fxcharts/
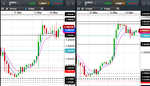
I attach the three hour candlestick chart so far this week for USDCAD and EURCAD. Times are GMT-3 . EMA channel (4,7) included. The VRM predicted the level 1.2984 for USDCAD last weekend and that was reached yesterday. The weekly VRM levels on the USDCAD chart can be found in the second attachment.
The second attachment is the USDCAD predictions for this week and tomorrow. Please read the documents on the first post of the thread "Predicting future FX support and resistance levels using mathematics" to understand the format.
May take on USDCAD. It is bullish because the short and long term trend channels are rising. And it will not be bearish again as it was June last year until it closes the week below 1.2588. And every week this level will keep rising as the VRM gets recalculated using the latest results.
I am using the Volatility Response Model (VRM) to follow the USDCAD and EURCAD which you can find described in the first post of the thread tade2win of the Forex forum
"Predicting future FX support and resistance levels using mathematics"
Normally this thread presents predictions and then results for GBPUSD each day and occasionally EURGBP and EURUSD.
You can find USDCAD and EURCAD predictions each day on the website
https://www.complexhamiltoniansystems.com/fxcharts/
I attach the three hour candlestick chart so far this week for USDCAD and EURCAD. Times are GMT-3 . EMA channel (4,7) included. The VRM predicted the level 1.2984 for USDCAD last weekend and that was reached yesterday. The weekly VRM levels on the USDCAD chart can be found in the second attachment.
The second attachment is the USDCAD predictions for this week and tomorrow. Please read the documents on the first post of the thread "Predicting future FX support and resistance levels using mathematics" to understand the format.
May take on USDCAD. It is bullish because the short and long term trend channels are rising. And it will not be bearish again as it was June last year until it closes the week below 1.2588. And every week this level will keep rising as the VRM gets recalculated using the latest results.
Attachments
USDCAD results for 15th March
Yesterday I attached the predicted support and resistance levels of USDCAD of the Volatility Response Model (VRM) for today.
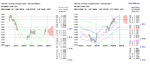
Here are the results for USDCAD.
Weekly VRM levels in the top 30 minute chart, daily VRM levels in the bottom 30 minute chart. Times are GMT-3 . EMA channel (4,7) included. You will find all these levels on yesterday's post # 525
Low for the day was at the lowest daily sentiment level 1.2947
Once the USDCAD broke through the highest daily sentiment level 1.2967 at 9 am (GMT-3) it was plain sailing up to the top of the daily short term trend channel at 1.3071.
There were some large gaps between VRM levels to trade between.
I always load predictions for VRM levels of USDCAD and 12 other FX pairs at the following link by 6 pm New York time.
https://www.complexhamiltoniansystems.com/fxcharts/
Take a look if you want to see tomorrow's levels.
Yesterday I attached the predicted support and resistance levels of USDCAD of the Volatility Response Model (VRM) for today.
Here are the results for USDCAD.
Weekly VRM levels in the top 30 minute chart, daily VRM levels in the bottom 30 minute chart. Times are GMT-3 . EMA channel (4,7) included. You will find all these levels on yesterday's post # 525
Low for the day was at the lowest daily sentiment level 1.2947
Once the USDCAD broke through the highest daily sentiment level 1.2967 at 9 am (GMT-3) it was plain sailing up to the top of the daily short term trend channel at 1.3071.
There were some large gaps between VRM levels to trade between.
I always load predictions for VRM levels of USDCAD and 12 other FX pairs at the following link by 6 pm New York time.
https://www.complexhamiltoniansystems.com/fxcharts/
Take a look if you want to see tomorrow's levels.
Attachments
Fed forecasts suggest three increases in the federal funds rate this year, and Bank of America Merrill Lynch believes that the Bank of Canada will not remain in debt.
Strategists at Bank of America Merrill Lynch believe that the Bank of Canada will follow in the footsteps of the Federal Reserve this year, but if the latter, based on its own forecast, raises the rate one more time, then from the Canadian central bank, we can expect three more increases - in April, July and October. BoAML emphasizes that the exact time of the increases is not exactly certain (perhaps the Bank of Canada will elect for this meeting in May, October and December) and will partly depend on the dynamics of the Canadian dollar, but the central bank will definitely have to act. BoAML note that in favor of tightening the policy says higher inflation, tougher labor market conditions and a good economic growth, which will still feel the consequences of fiscal stimulation in the US.
Bank of America, Merrill Lynch expects that by the end of 2018 the Bank of Canada rate will reach 2.00%, and the US dollar to Canadian currency will reach 1.25, and in 2019 - 1.23.
My USDCAD opened with a massive GAP down (55 pips), does anyone know what happened in the market?
US and Canada reached a trade deal to replace the existing North American Free Trade Agreement. My CAD trade (CADJPY) went 45 pips above my stop and closed there. It was fun waking up to it, though.
US and Canada reached a trade deal to replace the existing North American Free Trade Agreement. My CAD trade (CADJPY) went 45 pips above my stop and closed there. It was fun waking up to it, though.
Thank you for the info 👍
The USD regained the dominant position this week. Strange how the Canadian dollar is still rallying against other currencies. Tough market lately.
I guess CAD's strength is down to the strength in the crude oil price, NOK is likewise bullish against other currencies.
Similar threads
- Replies
- 0
- Views
- 2K