Trying to understand breakouts

S_D

Member
Messages
87
Likes
1
Mods, feel free to move this to another subforum.

People,

I'm trying to understand breakouts, and although Ms Turner's book demonstrates some lovely US stocks I'm trying to apply it to live UK scenarios, whilst paper trading.

Below is a chart of OOM (MMO2) that I believe is converging and will break out sometime during the next 3 days. I have setup alerts for going under 100p and going over 104p. Would this seem right? I'd look to go long at say, 104.25p and short and 99.75p.

Are there any traders here that see sense in what I'm trying to do or am I getting it all wrong?

Thanks for the input.

Simon

PS, how do I post charts as pictures?
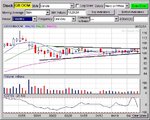
 

Attachments

  • oom.jpg
    oom.jpg
    74.2 KB · Views: 480
The one thing I would say is that you need to remember that 100p is also a big psychological area - 'less than a pound' makes many retail investors feel the need to buy 'because it is cheap'. Do remember however, that there is never a thing as a cheap stock - it's at that price for a very good reason.

You'll often see the price dip below 100p (on any stock, not necessarily this one) to permit all the stops to get hit, then bounce back up because of the buying.

So in your plan, just allow room for these psychological support and resistance points - you'll find that they are often at decade numbers (80, 90, etc) and at century numbers (100, 200, etc).
 
Skimbleshanks said:
The one thing I would say is that you need to remember that 100p is also a big psychological area - 'less than a pound' makes many retail investors feel the need to buy 'because it is cheap'. Do remember however, that there is never a thing as a cheap stock - it's at that price for a very good reason.

You'll often see the price dip below 100p (on any stock, not necessarily this one) to permit all the stops to get hit, then bounce back up because of the buying.

So in your plan, just allow room for these psychological support and resistance points - you'll find that they are often at decade numbers (80, 90, etc) and at century numbers (100, 200, etc).

Very interesting, thanks. So would you take the trade if 100p was penetrated? What would be your entry price?

Based on what you're saying I think it'd be wise only to go long, and ignore the short entry. I'm worried that In allowing space for the price to move clear of the movement to take the stops out, I'd actually miss most of the movement.

Anyone else like to bring some analysis on this?

Thanks,

Simon.
 
I wouldn't trade OOM, because I steer clear of all UK stocks. My comment was just to alert you to psychological support and resitance points which you should be aware of with any stock you are trading.

You mustn't translate my comments as the assumption to go long - not so at all! You must have no assumptions at all, but just trade what happens without worrying whether you'd miss most of the movement (your words). This is your greed speaking, and greed is a dangerous thing in trading, so just be aware of it.

My only comment would be to look very carefully at what has happened every time OOM dipped below 100p, so that you are prepared for what may, or may not, happen again. The price has not gone below 96p on your chart; therefore this is the key support area. In your first post you suggested that you would go short at 99.75p; there's not much reward on the table if the key support is at 96p.

There are many many stocks on the LSE, so the art in being a good trader is to spot the best opportunity given the best setup, irrespective of which stock it is on. You may find there are better reward/risk opportunities elsewhere.
 
Skimbleshanks

Why do you steer clear of all uk stocks?

Regards

bracke
 
I used to trade them, ages ago. But I found them to be slow and sluggish because of the comparatively low volume traded, with high commission charges, and the dreaded stamp duty.

I find that US stocks are far easier to trade because of the higher volumes, the commissions are smaller, there's no stamp duty, and I just have more confidence in buying/selling on electronically traded markets such as Nasdaq and Globex. I used to loathe the times I would have to wait for my order to be filled via a broker on UK stocks, but on Nasdaq and Globex there is virtually instantaneous fills right before your eyes - you know immediately where you are.
 
Here's an example of a 5 minute intraday chart of MSFT (Microsoft) to give you an idea of some of the intraday movements of a big US stock.

The commission with a direct access broker such as IB is $1 to buy 100 shares. $1 is approximately 60p. Nuff said? LOL
 

Attachments

  • microsoft corporation- 5 minute.jpg
    microsoft corporation- 5 minute.jpg
    49.2 KB · Views: 373
Top