Mods, feel free to move this to another subforum.
People,
I'm trying to understand breakouts, and although Ms Turner's book demonstrates some lovely US stocks I'm trying to apply it to live UK scenarios, whilst paper trading.
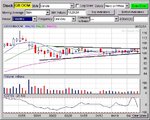
Below is a chart of OOM (MMO2) that I believe is converging and will break out sometime during the next 3 days. I have setup alerts for going under 100p and going over 104p. Would this seem right? I'd look to go long at say, 104.25p and short and 99.75p.
Are there any traders here that see sense in what I'm trying to do or am I getting it all wrong?
Thanks for the input.
Simon
PS, how do I post charts as pictures?


