So...my new goal is to daily chart the ES emini market via the 5m TF, shall we say? On a daily basis, as well as researching past days to better pick up patterns. Can I do this via an OHLC chart, or is that a separate kettle of fish? Well, I still don't know what "TF" means, but me, I'm jumpin' in....
You are using an out of date browser. It may not display this or other websites correctly.
You should upgrade or use an alternative browser.
You should upgrade or use an alternative browser.
rathcoole_exile
Guest Author
- Messages
- 3,925
- Likes
- 767
TF just means Time Frame
Ok.......Yes, TF means time frame.
This is the EU, any instrument will do, if you are in US, maybe you should try the SP500, I never traded it, but I trade the Dax.
Indicators? That is up to you. I only use the 20ema.
At the end of the day I mark where I could have made/lose money.
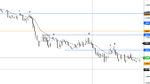
1) Before that bar a break below the last swing low, pulls back to support turned resistance, to the low of the previous day and to the average.
Order is placed (1pip) below the bar (signal bar), Stop loss is placed (1pip) above it, as soon as it triggered my SL is trailed 1 pip above the trigger bar. Now this is my risk.
At double of my risk I normally take profit, not all the time, but that is another story.......
What happened there?
Bears broke the range (the trend bear bar on the left), sideliner bears did not follow up, some covered.... bulls stepped in....
there was a bit of pushing and pulling that end up into a range (not drawn),
bears on the sideline where not convinced to short more from there, but they tried with the bar that ended up as a false breakout bar of that range (two bars before 1), bulls saw that and took the chance to push higher, others stepped in, with two consecutive trend bars and above the average.
There, they find their nose against technicality, some bulls coverer, bears had a better price to short and technicality would protect their protective stop, sideliner bulls where not convinced it was a great deal after all buying in resistance (not follow up).
Below bar 1, more bears joined in and bulls realise that they make a mistake becoming bears by covering and some reversing..............and so and on and on.....
There is a battle going on, in every charts and in ever TF.
Technicality is a great toll but by itself is not such a great edge as when combined with the psychology and the emotions of the participants.
I hope it helps a bit..
As a first read of TA I would suggest this:
http://www.amazon.com/Technical-Analysis-Trends-Robert-Edwards/dp/0814408648
This is the EU, any instrument will do, if you are in US, maybe you should try the SP500, I never traded it, but I trade the Dax.
Indicators? That is up to you. I only use the 20ema.
At the end of the day I mark where I could have made/lose money.
1) Before that bar a break below the last swing low, pulls back to support turned resistance, to the low of the previous day and to the average.
Order is placed (1pip) below the bar (signal bar), Stop loss is placed (1pip) above it, as soon as it triggered my SL is trailed 1 pip above the trigger bar. Now this is my risk.
At double of my risk I normally take profit, not all the time, but that is another story.......
What happened there?
Bears broke the range (the trend bear bar on the left), sideliner bears did not follow up, some covered.... bulls stepped in....
there was a bit of pushing and pulling that end up into a range (not drawn),
bears on the sideline where not convinced to short more from there, but they tried with the bar that ended up as a false breakout bar of that range (two bars before 1), bulls saw that and took the chance to push higher, others stepped in, with two consecutive trend bars and above the average.
There, they find their nose against technicality, some bulls coverer, bears had a better price to short and technicality would protect their protective stop, sideliner bulls where not convinced it was a great deal after all buying in resistance (not follow up).
Below bar 1, more bears joined in and bulls realise that they make a mistake becoming bears by covering and some reversing..............and so and on and on.....
There is a battle going on, in every charts and in ever TF.
Technicality is a great toll but by itself is not such a great edge as when combined with the psychology and the emotions of the participants.
I hope it helps a bit..
As a first read of TA I would suggest this:
http://www.amazon.com/Technical-Analysis-Trends-Robert-Edwards/dp/0814408648
Attachments
Last edited:
Yes...somebody that impressed me was talking about how studying volatility gave him an edge because most didn't. Well, I think it's a just plain good tool, because it's about expecting things to dance, seeing how they do dance.
Hm...at first glance, of reading that chart, sans any great knowledge, or technica terminology, I say after points one and two, you sell. Thing is if you though the market bomed out at 3, expecting it to go higher, you'd be wrong. Anticipate another dip at 6, 'n hibernate, though, you'd be in great shape. Hm.. if you'd conclude that 7'n eight was just an "m" pattern, you'd know to uh, "bear with it, and keep out, until the bell closes. Am I correct?
Dunno much more than that, but am I getting the ideas right? Hopefully, that's a start to reading charts, correct.
Last edited:
2) PB to the ema, the low of the day
3) PB (pull back) to the ema and that box could also considered resistance (they were fighting there, bears won and price is back.
6) PB to resistance (were bears pushed back before), above the ema, but the ema is just an average of 20 bars
7) PB to support turned resistance, but did not go far (loss)
8) With 7 formed a DTPBF (double top pull back flag)
I hope it helps another bit.
Remember there is time to study and time for trading, studying never end because markets always changes and we need to be like water, forget about terminology (they are only use to clarify), what we need to understand and take advance of is what is going on in terms of battle, we do not stand on either side, we weight the situation and then when the battle is won we jump in.
now no more from me, it is up to you. I hope you can see what I mean, I do not think is the the only way, but it is my way.
Last edited:
Good luck to you mate, after you read the book I suggested, you may try anything by Al Brooks and Bob Volman, Bob is much clearer, Al can be a bit of a mess, they both mean business where Price Action is king.
Still at the end of the day you have to find your own way, that is why I suggest to you to do your own work, your creativity and personality needs to come forth, from the others you can learn what they see and what they see is probably not right for you, at the end of the day "your balls" need to be there. You have to aspire to be the best in what you do, especially in the markets, there you will find also the best: the Japanese, the Australians, the germans, the Italians, the Americans e so on, they are all like sharks, and they will take your money out of you in a jiff, unless...........
Still at the end of the day you have to find your own way, that is why I suggest to you to do your own work, your creativity and personality needs to come forth, from the others you can learn what they see and what they see is probably not right for you, at the end of the day "your balls" need to be there. You have to aspire to be the best in what you do, especially in the markets, there you will find also the best: the Japanese, the Australians, the germans, the Italians, the Americans e so on, they are all like sharks, and they will take your money out of you in a jiff, unless...........
Last edited:
Mr. Charts
Legendary member
- Messages
- 7,370
- Likes
- 1,200
Read http://www.trade2win.com/boards/stocks/123944-how-make-money-trading-markets-78.html#post2446318
The whole thread....work and application are necessary to succeed.....read it ALL and you have a ready made off the shelf method. It's one of the dozen methods I've used since giving up my profession to trade for a living 14 years ago.
The whole thread....work and application are necessary to succeed.....read it ALL and you have a ready made off the shelf method. It's one of the dozen methods I've used since giving up my profession to trade for a living 14 years ago.
Thank you; for right now, I want to know two things.
First, I've got my Ninjatrader charting to work, but I don't know how to modify it, let alone use it. I have been told to save these charts, and also look up previous days, but I don't know how that works. Right now, I'm just following the ES 12-14 instrument at five minute intervals. Today has a lotta peaks, 'n valleys.
Wish I knew what the chart' side numbers, mean. 2073.00? Does it mean each individual contract
derivative's worth $20.73? If so, that makes certain sense. I could use a chart explanation, now, as with how to save and analyze charts, but I don't see it, here:
http://www.ninjatrader.com/support/helpGuides/nt7/index.html?charts.htm
Second, I need to find an explanation of how to read candlesticks. Some have wicks, and other don, and that's to denote the highs and lows of the interval in question before its close, right? If it's a green bar with an upper candlestick, that means it price rose, but the upper wick denotes the ppeaks rise within the period. A lower wick would show where price bottomed out. Am I warm?
Snow Flake
Newbie
- Messages
- 2
- Likes
- 0
It is so valuable
Information you shared here is so valuable, I must say thank you.
Information you shared here is so valuable, I must say thank you.
mate, let me give you some advice.
1. ignore 99% of advice on here, including my own if it pleases you to do so
2. draw 2 horizontal lines on your chart, Monthly Pivots based on last months OHLC
3. sit, and sit, and sit, and sit, until price nudges either price line and Fade it, ie go Long at the lower price line, Short at the upper
If a trade doesn't get triggered at all, so what, your net results will still be better than 95% of day-traders
After 3 years of doing that, move to Weekly pivots
And after 5 years of doing that, move to Daily pivots
Similar threads
- Replies
- 3
- Views
- 2K
- Replies
- 3
- Views
- 10K
- Replies
- 16
- Views
- 4K
- Replies
- 3
- Views
- 2K