Trendline Trading Strategy by Myronn vs Tom Demark Trendline

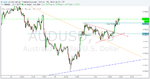
Done the above, now I am going close to the price, because I am trading the NOW, not what has been and not what I like i to be.....

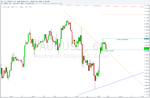
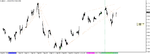
Before the the last drop what happened?

Prices broke down strongly the lower channel line (prices are always in some kind of channel), indicating strong bear, made a double bottom on a major up trend line (bears taking profits and sideline bulls going long).

Bulls got to the magnet line (support turned resistance), what happened there? Went into a flag (indecision), the flag broke and failed( fail final flag) just at the magnet level.

What else is there? A low 2 bear flag or a double top bear flag or an abc pattern, but do not get lost in nomenclatures, in a bear if bulls try twice and fails normally the opposite happens.

What else is there? There is small trend reversal with a test of the extreme which is also the high of the previous day .

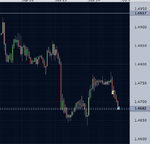
took 35 pips out of it, 2.2%, sell order was placed before I went to class, news coming in 25 minutes. it can go either way....only one trade today.

Done.
 

Attachments

  • close trade.png
    close trade.png
    21.8 KB · Views: 278
And despite the good news for cad bulls got interested at those major UTL's and guess where they got stopped by the bears? At that DTL and Magnetic line.
 

Attachments

  • eu.png
    eu.png
    26.8 KB · Views: 247
Hi Fugazsy. I hope you had a pretty good weekend. Ok so I just scanned the charts this evening and I have 2 possible set ups forming on the EUR/JPY and AUD/USD. By the way how many pairs are you watching (out of curiosity)? I watch 18 pairs. Coming back to the 2 opportunities. Please correct me if I'm wrong. Let's have a look at the EUR/JPY pair first. Screen Attached.

EUR/JPY Reasons for going short on the 4 hour TL (entry on the 1-hour chart)

1. Throughout the previous week, the bulls were trying to break the 114.00 level but they have failed on 3 occasions. It happened repeatedly on the 4 hour downward TL.

2. Also, It looks like the previous level of support turned resistance is holding up.
3. Shooting star formed just at the top of the 4 hour TL.
4. The pair is also strongly overbought following the large bull candle.

AUD/USD (Screenshot below). I just want to point out that I am going to be careful here as the decision rate in Australia is coming out on Tuesday.

Reasons to go long on the break of the 1 hour resistance

1. Break of the 1 hour TL.

2. Retest of the resistance turned support level,
3. Bull Flag forming.

It would be great to see your take on those 2 charts, as I would like to see what have I missed if I missed anything.

Thanks

David.
 

Attachments

  • AUDUSD 1hour.png
    AUDUSD 1hour.png
    69.2 KB · Views: 300
  • EURJPY 1 Hour.png
    EURJPY 1 Hour.png
    43.9 KB · Views: 225
Hi Fugazsy. I hope you had a pretty good weekend. Ok so I just scanned the charts this evening and I have 2 possible set ups forming on the EUR/JPY and AUD/USD. By the way how many pairs are you watching (out of curiosity)? I watch 18 pairs. Coming back to the 2 opportunities. Please correct me if I'm wrong. Let's have a look at the EUR/JPY pair first. Screen Attached.

EUR/JPY Reasons for going short on the 4 hour TL (entry on the 1-hour chart)

1. Throughout the previous week, the bulls were trying to break the 114.00 level but they have failed on 3 occasions. It happened repeatedly on the 4 hour downward TL.

2. Also, It looks like the previous level of support turned resistance is holding up.
3. Shooting star formed just at the top of the 4 hour TL.
4. The pair is also strongly overbought following the large bull candle.

AUD/USD (Screenshot below). I just want to point out that I am going to be careful here as the decision rate in Australia is coming out on Tuesday.

Reasons to go long on the break of the 1 hour resistance

1. Break of the 1 hour TL.

2. Retest of the resistance turned support level,
3. Bull Flag forming.

It would be great to see your take on those 2 charts, as I would like to see what have I missed if I missed anything.

Thanks

David.


Hi David

I do not trade ej but I trade au.....chart is coming

I only trade 10 pairs GU, EU,GJ,UJ,GA,EA,NU,UC and EC.
 
Blue horizontal line is the begging of the month: slightly bullish, prices went very high and very low.
Previous week slightly bullish and again prices went very high and very low.
Last couples of days we had a bear day and a slightly bull, prices went lower (3 pushes down also a double bottom bull flag with the low of the week) Following me?

What happened in this month? We had a bull a bear and now a bull where bears broke a few major trend lines after a wedge, is this bull channel a flag of the previous bear?
 

Attachments

  • au 1.png
    au 1.png
    27.3 KB · Views: 229
Last edited:
now before I post my chart close to price I want you to understand that there high probability set ups and many other set ups, for the little I understand H/P set ups are: (1)Major trend reversals, (2)high 2 bull flag/low 2 bear flag in s a strong trend and (3) Fading the new extreme in a range market.

It will be helpful for you to try to spot them on my previous chart and get back to me on that.
 
By now I have an idea of what has been but I am very careful no to biased, because if I am biased my view will be narrowed....

Close to price I draw my trend lines and trend channels lines (remember prices travels always in channels)

Here I am looking if my favorite patterns will develop. Did you study them?

NOW, There is Break out of Trend channel line with a bull trend bar followed by a pause bar (flag), a test of the previous day high (slightly bull day went lower) , a possible double top bear flag, just above there is the major TL broken.....

Lets see...
 

Attachments

  • AU 2.png
    AU 2.png
    28 KB · Views: 351
By now I have an idea of what has been but I am very careful no to biased, because if I am biased my view will be narrowed....

Close to price I draw my trend lines and trend channels lines (remember prices travels always in channels)

Here I am looking if my favorite patterns will develop. Did you study them?

NOW, There is Break out of Trend channel line with a bull trend bar followed by a pause bar (flag), a test of the previous day high (slightly bull day went lower) , a possible double top bear flag, just above there is the major TL broken.....

Lets see...

Hi Fugazsy touching on the AUDUSD, the analysis I posted yesterday. There was a triangle forming or pennant forming (continuation pattern). It also broke the support level and retested on the 15 min chart successfully. In my opinion it would be to go long on the pair as they long term trend is still bullish.

I lost you there when you said you would like me to analyse the chart and If I can spot the opportunities which chart are you talking about?

Was my AUDUSD analysis good or not?

P.s

I studied those patterns in the past, just answering your question from the previous post.
 

Attachments

  • AUDUSD.png
    AUDUSD.png
    54.4 KB · Views: 256
Last edited:
Maybe it will be a good idea to start from a blank chart and I will be able to post my analysis to see if I am doing it right and have the right approach?
 
Hi Fugazsy touching on the AUDUSD, the analysis I posted yesterday. There was a triangle forming or pennant forming (continuation pattern). It also broke the support level and retested on the 15 min chart successfully. In my opinion it would be to go long on the pair as they long term trend is still bullish.

I lost you there when you said you would like me to analyse the chart and If I can spot the opportunities which chart are you talking about?

Was my AUDUSD analysis good or not?

P.s

I studied those patterns in the past, just answering your question from the previous post.

That is a bit too strong for me.......

Yes your analysis is good but I would not take it. Why? I explained it before in my previous posts.

How do you determine the long term trend is bullish?
 
Last edited:
That is a bit too strong for me.......

Yes your analysis is good but I would not take it. Why? I explained it before in my previous posts.

How do you determine the long term trend is bullish?

Anyway, I suggest you carefully study all my previous posts and make a search and study the patterns together with the best probability trades I mentioned.

If you find them valuable after you carefully studied and practice them then maybe we can chat again.

Fzsy
 
Anyway, I suggest you carefully study all my previous posts and make a search and study the patterns together with the best probability trades I mentioned.

If you find them valuable after you carefully studied and practice them then maybe we can chat again.

Fzsy

Hi. I will study them... maybe we can chat again in the future.
 
By now I have an idea of what has been but I am very careful no to biased, because if I am biased my view will be narrowed....

Close to price I draw my trend lines and trend channels lines (remember prices travels always in channels)

Here I am looking if my favorite patterns will develop. Did you study them?

NOW, There is Break out of Trend channel line with a bull trend bar followed by a pause bar (flag), a test of the previous day high (slightly bull day went lower) , a possible double top bear flag, just above there is the major TL broken.....

Lets see...

and here we go:

A major TL break, a trading day reversal in combination with a wedge or 3 pushes up.....
 

Attachments

  • au.png
    au.png
    27 KB · Views: 252
hello ppl,

I would like to ask you if any of you have Myronn's ebook with
TITLE: TRENDLINE TRADING STRATEGY SECRETS REVEALED

If you have it can you please post it or send it at my email?

Thanks and many regards
 
Top