Now I got interested, +31 pips +3.6%
and market turned or at least a pause at a break out pull back..... not taken
Now I got interested, +31 pips +3.6%
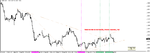
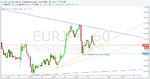
AU 60m
1. Major trend reversal
2. Magnet
3. 3 pushes up or wedge
4. Upper trend line.
Hi Joe, how are you?
David
I hope you got a bit of a grasp of what I am talking about.
Done for a day...two trades.
Not all days nice like this.....lately I had 6 consecutive losses and that burns a bit....
and I went back to the drawing board.....this is what it is all about....learning every day from ourselves.....the moment we feel we have nothing to learn market or life will prove us wrong.
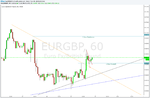
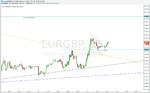
Hi Fugazsy, Thanks for posting your examples of your trades, I guess it was a pretty good day for trading. I am getting they way you are analysing the charts, as you said at the beginning you can't really take the trades based on the trend lines alone and I agree with you 100%, I always looked at at least 3 confirmations for a trade. I have to say I like the way you are looking at trades, it's simple and effective and I was always a fan of that. Now I wanted to tell you about the trade that I just set up for EUR/GBP.
Reason for going long:
1. Bull Flag formation (You can see it clearer on the 15 min chart)
2. Resistance turned support (1hr). Retest after the breakout.
3. Break of the trend line.
4. Also on the 15 min you can see a trading range breakout.
I entered the market on the 15 min chart at 0.8653 with a target of the last peak on the hourly chart.
David
Great analysis I think. A break out pull back at the magnet level.
What I am not sure about is your signal line, look at the the 15 bar which touched
the magnet horizontal line, is a range bar.....here personally I want to see a trend bull bar. Also be aware of timing, this is NA closing, big boys are closing books, could not be a clear direction and can end up in nothing, I would at least wait for Sydney open.
Remember our job is to spot a possible "struggle between the parts and wait for one of them to let go of the rope and joining the other part by covering at a loss in creating a double pressure in one direction only". Here and only here we jump on wagon.
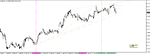
One chart at the time:
Start with this
Lets say I trade the 60m, I do not need to do my analysis on a bigger TF, just zoom out.
Magenta lines are the weekly and the green lines are the daily, I just need 2 of each one.
Need to go to my yoga class.....chat later.
So you are not using the larger time frame to put those lines in? Let's talk after your class 🙂 It would be nice to find out how you are using those vertical lines? You are not using the larger time frame for the longer trend view?
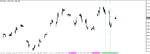
Look what happened in the previous week looking at my charts, the magenta lines determine the previous week: prices more or less finished where they started, just a bit bullish. Price went first lower and then higher after she made a triple bottom and fail final flag.
This week prices are just now a bit below from when she started but went very high, broke a major TL and went down with a HL (an under shoot test of the recent high, good pattern to trade)
The day before yesterday (green line) was a strong bear, yesterday a bull after making a double bottom (a pull back of the strong bear?)
Based on this information I have a view of the actual market condition, the overall view is a range but the most current one is a bear, the last movement down was too strong for me to consider going long.....Said that counter traders bulls did make money in that double bottom which is also a double bottom bull flag taking in consideration the swing low of the 23/9 (triple bottom mentioned).
So taking everything what you said into consideration, when you are trading the H1 charts do you only consider the previous week highlighted by your Magenta lines and look how the price action develops on a daily basis? (highlighted in green lines). Just to let you know I trade both larger and lower time frames, so I look at the longer term trends and TLs as the price might be approaching the major TL as there might be a good opportunity to trade it and If I see a ranging market on a daily TF I'd rather stay out of it as the market is not very attractive.
Good question
Trading is not black and white, if it was we would be all very rich.
You need to learn the skills and then you need to bring yourself forward, because trading at a certain level is an art form, there is a certain kind of creativity involved.
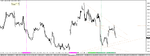
Yes I do look at the last two week in my TF but I also have a brief look at the monthly, weekly, daily and 240m.
But if you have a look at the 60m chart zoomed out you will see that the latest bear channel is just a larger bull flag, there are trends inside trends, the smarts bulls entering at the double bottom knew that, their risk was tiny and they knew what they were doing.
Are you following me?
Yes, I am following you, the way you are analyzing the charts it's simple yet effective. When I get back home from work I will have a lot more time to go and do some of my own analysis which I will share in this post later on today.