Trendline Trading Strategy by Myronn vs Tom Demark Trendline

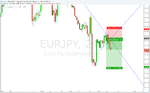
so a quick update. I am really gutted on the GBP/CAD I should have left it as it traded further 70 pips :(... however I just locked in 80 pips on the GBP/JPY trade and moved my take profit down to the daily up trendline to 129.50 which is going to give me roughly 6:1 ratio on this trade. I think that will be it for this week of trading, I will be updating this thread regularly so If anyone would like to join in and exchange some ideas, please go ahead. On the side note, as soon as you get the trend lines right and you follow the set of rules the return is really good on it. Just to be honest with you my account it's not huge we are looking at £2200 as of now. But taking all the trades from this week into account with a risk of 2% per each trade, you'd be looking at the below profit:

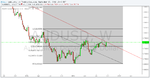
EUR/NZD = 2:1 ratio = £88 profit
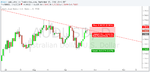
GBP/CAD = 1.56:1 = £68 profit
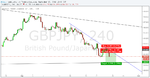
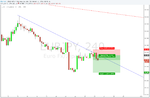
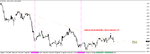
GBP/JPY (if it will hit my target) = 6:1 = £264 profit

In total = £420 profit, it wouldn't be too bad for a week worth of trading.
 

Attachments

  • GBPJPY.png
    GBPJPY.png
    53 KB · Views: 242
Trade idea for the next week.

Hi everyone. it's me again:) it looks like it's only me posting here..... anyway... if anyone would like to have a look at the below trade it might be a good one for the next week. The trade in question is AUD/USD on a weekly trendline please see the screenshot. The price seems to be respecting the weekly trendline on the daily trend line (another screen shot). Also the retracement which you will be able to see on the weekly AUDUSD chart is right on 61.8% Fibonnaci retracement. What do you guys think? It's nice 2:1 ration trade.
 

Attachments

  • AUDUSD.png
    AUDUSD.png
    57.3 KB · Views: 640
  • AUDUSDdaily.png
    AUDUSDdaily.png
    47.4 KB · Views: 519
Hi Everyone. Quick update. I now placed the order on the Daily chart of AUD/USD as mentioned above. I also placed a trade with a nice ration 1:3 on the EUR/JPY. Please see the screenshot. There was a nice set up which developed, a shooting star right on the 4 hour downward trend line. I set the order for 5 pips below the shooting star and so far it's going in the right direction. I will update later on today on how I got on.
 

Attachments

  • EURJPY4hr.png
    EURJPY4hr.png
    60.7 KB · Views: 301
Update on the above trade.

So far, so good i will see how the price is going to react on the last support level, hammer on the left. If it's going to go through I will leave the trade on and move the stop loss to break even. If it's going to respect that support I will close half of the trade and move the stop loss to break even to make sure I will take some profit out of it.
 

Attachments

  • EURJPY4hr.png
    EURJPY4hr.png
    61.8 KB · Views: 584
Update on the above trade.

So far, so good i will see how the price is going to react on the last support level, hammer on the left. If it's going to go through I will leave the trade on and move the stop loss to break even. If it's going to respect that support I will close half of the trade and move the stop loss to break even to make sure I will take some profit out of it.

Update. I closed the trade after the hammer formed as I thought that the market has lost its momentum and I was right so it was a good decision. I locked in 45 pips on this trade.
 
It also looks like the AUD/USD trade didn't activate, the candle is now piercing the weekly downward trend line. I will be looking to go long after this week.
 
A quick update on today's trades. So I actually took 2 trades today on one pair and it was GBP/CAD.... now there are 2 sides to this story:) As you can see per the below picture I had 2 upward trendlines covering the most recent troughs on the chart. I took the trade as per my strategy 5 pips above the reversal signal on the bounce (green arrow) was my entry and my stop was placed 5 pips below the indecision candle, everything was going well until that big red ugly engulfing pattern appeared right on my chart, so what I did I closed the trade with a loss of 18 pips. But what I noticed after that that as per my strategy I should have drawn another trend line from the most recent low and that's how I came up with the Trendline number 2, and that where I took another trade on a green candle which followed the big ugly one. My target was the recent high at 1.7184 and it hit my target easily within an hour time. 64 pips on the 2nd trade minus the first one which gave me a total of 48 pips for today.
 

Attachments

  • GBPCAD.png
    GBPCAD.png
    76.1 KB · Views: 462
Just a quick update on the trade that I just placed. I saw a great opportunity on the EUR/GBP just now on the 4 hour chart. Please see the screenshot. I personally think it's a great opp as you have nice 1:4 RR here. well let's see how this one is going to workout.......
 

Attachments

  • EURGBP.png
    EURGBP.png
    65.3 KB · Views: 397
It would be great if anyone could contribute their ideas and make this thread really stand out as I think it's a great opportunity for everyone to learn, if not I won't support this thread anymore..... happy trading everyone.
 
Hi everyone, I hope you are all doing well.

The reason for this thread is pretty simple, I am following the below strategy called Trendline Trading Strategy, the guy who posted on the below link had a really good results from it.

http://forex-strategies-revealed.com/advanced/trend-line-trading-strategy

However, when it comes to myself I am having a dilemma on how to properly draw trend lines. I have read numerous books on how to draw them, but I think too much information is not good as I am confusing the rules here.

Of course every single person says to draw the trendline from the obvious peaks and troughs which is pretty simple right? But I still got few questions about adjusting the trendlines and and choosing the new peaks and troughs.

Some people are saying that you need to adjust the trendline from the anchor point where the trend started to the latest peak or trough without cutting through any candles on the way up or down. Again very simple concept but is it correct? The reason why I am asking about it is because few days ago I read about the way of drawing trendlines by Tom Demark which advises to actually use the most recent peaks and troughs as the demand line is changing, basically he is reading the charts form right to left. Which way do you guys draw the trendlines? I posted the below chart as an example, which one is correct or both of them are correct?

Which trendline is more significant Trendline 1 or 2?

Your lines are both correct and the more significance depend on the market conditions.

Keep in mind the biggest volume is made by computers which take in consideration classic technicality including trend lines.

Once they see two points, good traders traders will draw a line and watch to see if the market reverses if it get back to the line. They are constantly erasing lines that the market is ignoring and are always drawing new ones.

For what I remember Tom trend lines are good for break out (correct me if I am wrong), break outs are good to trade because most will fail.

I suggest you also have a look at Vic Sperandeo TLines for major reversals.

In my humble view TL's are very important in trading but it will be limiting to focus on them only , I suggest you have a look at what happens between the TL's:
Major trend reversals, flag and failed final flags, breakouts, high 2 bull flags or double bottom bull flag, wedges or 3 pushes up, Channels, Trading range reversal and Magnets.

I you want I will post you a chart to see what I mean by it....
 
Last edited:
Your lines are both correct and the more significance depend on the market conditions.

Keep in mind the biggest volume is made by computers which take in consideration classic technicality including trend lines.

Once they see two points, good traders traders will draw a line and watch to see if the market reverses if it get back to the line. They are constantly erasing lines that the market is ignoring and are always drawing new ones.

For what I remember Tom trend lines are good for break out (correct me if I am wrong), break outs are good to trade because most will fail.

I suggest you also have a look at Vic Sperandeo TLines for major reversals.

In my humble view TL's are very important in trading but it will be limiting to focus on them only , I suggest you have a look at what happens between the TL's:
Major trend reversals, flag and failed final flags, breakouts, high 2 bull flags or double bottom bull flag, wedges or 3 pushes up, Channels, Trading range reversal and Magnets.

I you want I will post you a chart to see what I mean by it....

Hi. Your input is most appreciated. It would be great to see your chart. Will you be able to post it? On the other hand I am not focusing only on the trend lines as that would be premature, I do focus on the patterns themselves and the actual candlestick, I also use momentum to track the price action. Thank you for the Vic's Tlines I will look into it today 100%, as you never stop learning. When you are going to have some free time, please post your chart. Thank you.
 
Hi. Your input is most appreciated. It would be great to see your chart. Will you be able to post it? On the other hand I am not focusing only on the trend lines as that would be premature, I do focus on the patterns themselves and the actual candlestick, I also use momentum to track the price action. Thank you for the Vic's Tlines I will look into it today 100%, as you never stop learning. When you are going to have some free time, please post your chart. Thank you.

You are welcome.

EU 60m

Here i was looking to trade a major trend reversal:

TL 6 was broken, healthy pull back (bears interested but bulls still in play), now I am looking for a test of the recent high to short

( before that there is another good set up going long to test the recent high which is a an high 2 bull flag, not marketed and which I did not take)

Prices reverse with an overshoot of the recent high with a trend bar at 1, also a wedge or 3 pushes up and a fail final flag (the range of the flag is 8), I went short 1 pip below the trend bear bar. (always look for more then one reason to take a trade)

At 2 prices meet the up TL, there is not rejection and I stayed put, formed a flag and then broke below.

I did not take profit at the previous swing low (H2 bull flag, I was sleeping), prices pull back and gave another signal at 3 which is a magnet level (support turn resistance), I did not take this trade because I am already short and afterwards took profit at the double bottom bull flag marked as an horizontal line.

Prices went up again and stalled at 4 (a possible low 2 bear flag and bounce of the down TL). I did not take this trade because is a bit late for me and that pin bar is not strong enough.

This is what I mean by drawing TL"s, they are powerful tools but we need to interpret what is behind the technicality, patterns are the representation of the psychology of the participants. (the one I mentioned in my prior post are my favorite to trade and the all use TL"s)

There is a constant tug of war going on at every moment (between the part taking also in consideration the sideliners) and it is showing on the chart and if we read it properly we can see when the direction of least direction is shifting on one side then the other and we need to be ready to jump on the wagon.

Said that you need to do your own homework and them bring yourself forward.

Hope it helps a bit.
 

Attachments

  • eu.png
    eu.png
    19.2 KB · Views: 6,092
Last edited:
You are welcome.

EU 60m

Here i was looking to trade a major trend reversal:

TL 6 was broken, healthy pull back (bears interested but bulls still in play), now I am looking for a test of the recent high to short

( before that there is another good set up going long to test the recent high which is a an high 2 bull flag, not marketed and which I did not take)

Prices reverse with an overshoot of the recent high with a trend bar at 1, also a wedge or 3 pushes up and a fail final flag (the range of the flag is 8), I went short 1 pip below the trend bear bar. (always look for more then one reason to take a trade)

At 2 prices meet the up TL, there is not rejection and I stayed put, formed a flag and then broke below.

I did not take profit at the previous swing low (H2 bull flag, I was sleeping), prices pull back and gave another signal at 3 which is a magnet level (support turn resistance), I did not take this trade because I am already short and took profit at the double bottom bull flag marked as an horizontal line.

Prices went up again and stalled at 4 (a possible low 2 bear flag and bounce of the down TL)

This is what I mean by drawing TL"s, they are power full tool but we need to interpret what is behind the technicality, patterns are the representation of the psychology of the participants. (the one I mentioned in my prior post are my favorite to trade and the all use TL"s)

There is a constant tug of war going on at every moment (between the part taking also in consideration the sideliners) and it is showing on the chart and if we read it properly we can see when the direction of least direction is shifting on one side then the other and we need to be ready to jump on the wagon.

Said that you need to do your own homework and them bring yourself forward.

Hope it helps a bit.

Hi. This helps a lot indeed, I'd say it's an enhanced way of using trend lines which I really like. I will have to study the picture today just to get the gist of it and then read up on it as well. Thank you for your contribution and I will let you know how I get on. Thanks again.
 
Hi Fugazsy, Ok so it's a quick shot, taking your thinking into consideration and the below chart I would analyze this way. The below picture is GBP/USD on the 60 min. The blue line is 4 hour trend line, the black trend line below is the daily trendline.

On the 4 hour GBP/USD chart the price just made a bull flag (2nd Picture). On the 60 minute chart, the trendline got broken and the price is not using the trendline as support. There is a Hourly resistance on the chart as well. Taking the bull flag, the trend line break into consideration I would set a buy stop order just above the hourly resistance with a target to test the daily resistance which is also visible on the chart. Would you add anything to it or you think I am analysing this in a wrong way?
 

Attachments

  • forum fugazsy.png
    forum fugazsy.png
    71 KB · Views: 432
  • bull flag.png
    bull flag.png
    69.2 KB · Views: 785
Hi Fugazsy, Ok so it's a quick shot, taking your thinking into consideration and the below chart I would analyze this way. The below picture is GBP/USD on the 60 min. The blue line is 4 hour trend line, the black trend line below is the daily trendline.

On the 4 hour GBP/USD chart the price just made a bull flag (2nd Picture). On the 60 minute chart, the trend line got broken and the price is not using the trendline as support. There is a Hourly resistance on the chart as well. Taking the bull flag, the trend line break into consideration I would set a buy stop order just above the hourly resistance with a target to test the daily resistance which is also visible on the chart. Would you add anything to it or you think I am analysis this in a wrong way?

Your analysis is not wrong, it is your perception based on your experience, with time and further experiences you would know a bit more if that knowledge is gained from the the right education. (too much BS around)

Keep in mind knowledge in technicality will not necessary produce positive results, technicality will only help us give information of the present market conditions which is the first thing we need to weight before we consider taking a trade: Is the market ranging? Trending? Did a major trend line broke? How did it broke? Is prices in a wedge? expanding triangle? channel?

All those information will give you a view of the present market conditions.

One other important factor you need to take in consideration is that it does not matter if you analysis is right or wrong, if market movers are not in, your trade will go nowhere.

Will I take a trade if prices touches any technically I carefully drawn and considered?, No I would not because if the marker movers do not get involved I will stay out confirming my analysis is only my perception until I am proven right.

So if a major trend line is broke and prices is testing a the new extreme with 3 pushes up and and fail final flag (3 reasons), then I want to see a nice reversal bar before I get in.....

I suggest you give yourself a bit of time in learning all this bit and pieces ....first books I will start with is:
https://www.amazon.com/Technical-Analysis-Financial-Markets-Comprehensive/dp/0735200661

Regarding GU I will post my perception on a chart.
 
GU 60m

As you can see the steep trend line is telling me yes is a bear but bulls are showing interests.

Bears are making sure prices is kept below the major TL (4 touches before 1).

Close to price I draw a bull channel (bear flag) and an expanding triangle.

At 1 prices give me 2 reasons to get short (3 is better):
a bounce at the major TL, a trading range reversal ( just went above the previous day high).

Now look at the reversal bar there (1), is that a trend bear bar closing near its low? Now it is not, it is a range bar, now in range is best you buy low and sell high, you do not sell low.

And that is why I stayed out: "there is time to go short, time to go long and time to go fishing".

Said that the market could also prove me wrong having a range bar as a signal bar and still continue south, but I cannot control that because I know anything can happen and I am only taking trades following my plans and my perception.
 

Attachments

  • GU.png
    GU.png
    24.3 KB · Views: 634
AU 60m

1. Major trend reversal
2. Magnet
3. 3 pushes up or wedge
4. Upper trend line.
 

Attachments

  • au.png
    au.png
    27.4 KB · Views: 560
GU 60m

As you can see the steep trend line is telling me yes is a bear but bulls are showing interests.

Bears are making sure prices is kept below the major TL (4 touches before 1).

Close to price I draw a bull channel (bear flag) and an expanding triangle.

At 1 prices give me 2 reasons to get short (3 is better):
a bounce at the major TL, a trading range reversal ( just went above the previous day high).

Now look at the reversal bar there (1), is that a trend bear bar closing near its low? Now it is not, it is a range bar, now in range is best you buy low and sell high, you do not sell low.

And that is why I stayed out: "there is time to go short, time to go long and time to go fishing".

Said that the market could also prove me wrong having a range bar as a signal bar and still continue south, but I cannot control that because I know anything can happen and I am only taking trades following my plans and my perception.

Now I got interested, +31 pips +3.6%
 

Attachments

  • gu.png
    gu.png
    26.4 KB · Views: 1,925
Top