Dentalfloss
Legendary member
- Messages
- 63,404
- Likes
- 3,726
spx


Time to wrap up for me, its been a very good week and some great calls from you guys and its good to see other members contribute.
:clap::clap::clap:
Even better nowdump
excellent
our res workin nicely
took dax with it
luvin it
Even better now


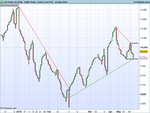
As part of my occasional contributions to this thread, the chart below shows how I see the Dax currently - and what the coming week(s) might bring.
View attachment 224856
What you're looking at is, IMO, a woefully under utilized charting method: 3 line break. Although, in this case, it's a 5 line break and, instead of basing it on (x) minutes, hours or days, each 'line' is 10,000 ticks. You can see that it characterizes the key swings rather well. The trend is down from the start of the year until a turn around in early to mid February. The current up trend remains in tact, but only just. A lower swing high printed on 10th May and, last week, saw price flirting with the green trend line and a possible breach of the previous higher swing low.
A clear breach of the upper horizontal black resistance line would indicate to me that the up trend is set to continue. Whereas, a clear breach of the lower horizontal black support line would indicate that the up trend is over and price is once again set to head south. Self evidently, it's slap bang in the middle between the two at the moment with no clear bias in either direction.
Tim.
Did you trade those entry points Tim?
As part of my occasional contributions to this thread, the chart below shows how I see the Dax currently - and what the coming week(s) might bring.
View attachment 224856
What you're looking at is, IMO, a woefully under utilized charting method: 3 line break. Although, in this case, it's a 5 line break and, instead of basing it on (x) minutes, hours or days, each 'line' is 10,000 ticks. You can see that it characterizes the key swings rather well. The trend is down from the start of the year until a turn around in early to mid February. The current up trend remains in tact, but only just. A lower swing high printed on 10th May and, last week, saw price flirting with the green trend line and a possible breach of the previous higher swing low.
A clear breach of the upper horizontal black resistance line would indicate to me that the up trend is set to continue. Whereas, a clear breach of the lower horizontal black support line would indicate that the up trend is over and price is once again set to head south. Self evidently, it's slap bang in the middle between the two at the moment with no clear bias in either direction.
Tim.

