Dentalfloss
Legendary member
- Messages
- 63,404
- Likes
- 3,726
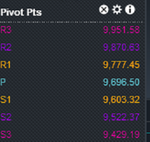
spx
nowt much happening
data from 16th feb

nowt much happening
data from 16th feb

possible scenario
oil bounce off 50%
whispers of Draghi QE
index rallies on that
any veiws ??
oil bounce off our pivot..took index with itpossible scenario
oil bounce off 50%
whispers of Draghi QE
index rallies on that
any veiws ??


wham37.20 test res if it gets there
prev supp
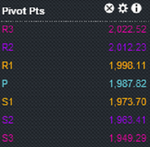
bounced nicelyoil/wti
smack in our 50% area we posted yesterday..yellow