US September 2017 Labour report: "Earnings Jump, Unemployment drop trounces Payrolls noise"
a) Payrolls / Establishment survey - Payrolls were always going to be nothing more than a lottery. -33K clearly much worse than expected, with a colossal drag from Leisure/hospitality at -111K, which should not come as a big surprise given the volume of people employed in that sector in Florida, which bore the brunt of Hurricane Irma. In contrast to the ADP report, there was no offset from Construction (+8K) or Manufacturing (-1K). This will all doubtless see some quite hefty revisions, as well as further distortions in coming months.
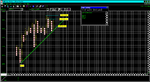
b) Unemployment Rate / Household Report - The contrast with Payrolls was particularly sharp, with Employment seeing a whopping 906K gain and Unemployment a large 331K drop, with the Workforce also rising (as it typically does at this time of the year) sharply +575K. These in turn combined to drive the Unemployment Rate to a new cyclical low of 4.2%, the lowest level since March 2001, though the fall in the Underemployment Rate to a new low of 8.3% is the bigger story, edging ever closer to the mid 'noughties' low of 7.9% - see charts. FYI: the Labor Dept noted that the household survey showed 1.5 Mln people could not go to work in sept because of bad weather, while 2.9 Mln worked part-time.
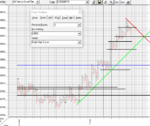
c) Average Hourly Earnings / Weekly Hours - Average Hourly Earnings 0.5% m/m jump, aided by a modest upward revision to August to 0.2% m/m, pushed the y/y rate up to a new cyclical high of 2.9%, which is more impressive in trend terms, rather than presenting the FOMC with a real headache. The more so from the aspect that hurricane related labour shortages doubtless distorted this month's reading (and probably in coming months), though the extent to which that is / was a function of a tight labour market will only become clear later in the year. Average Weekly Hours posted a marginal 0.1% m/m drop, with manufacturing hours flat at 40.7, suggesting a marginal gain in Industrial Production.
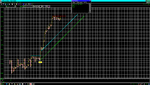
d) Market reaction - Unsurprisingly markets chose to largely ignore the Payrolls noise, and instead focus on the drop in the Unemployment Rate, and above all on the Earnings jump. Nevertheless there appears to be a degree of reticence to breach many key levels decisively, be that on the US Dollar Index at 94.20, the 30-yr US Treasury yield 200 day Moving average 2.925% or the key 1.1680 prop on USD/EUR, while the dip in the S&P500 is best described as very modest. The Dec Fed rate hike probability has also only seen a marginal shift higher to 80.2% vs. 76.7% ahead of the release. Reaction may in part have been restrained by the Columbus Day holiday in US bond and money markets on Monday. Be that as it may, the Fed majority's hawkish 'lean' in recent weeks looks all the more justified, and the drift higher in US Treasury yields requires ever close monitoring, particularly given the potential impact on super tight spread levels in Investment Grade, High Yield and EM credit markets.
- Charts: USD TWI, US 30yr yield, S&P500 future, US Unemployment and Underemployment Rates, & Average Hourly Earnings
- Tables: Fed rate hike probabilities
..........................................................................
Marc Ostwald
Global Strategist
ADM Investor Services International
Tel: 020 7716 8534
E-mail:
[email protected]
..........................................................................
TABLE: September 2017 Labour market report
Oct 6 (Reuters) - U.S. Labor Department seasonally adjusted jobs data.
In 1,000s, Change Sept Aug (Prev) July (Prev)
in Nonfarm Payrolls -33 169 156 138 189
Jobless Rate (Pct) 4.2 4.4 4.4 4.3 4.3
Earnings, Hours of All Private, Non-Farm workers:
Sept Aug (Prev) July (Prev)
Avg Weekly Hours 34.4 34.4 34.4 34.4 34.5
Manufacturing Hours 40.7 40.7 40.7 40.9 40.9
Overtime Hours 3.3 3.3 3.3 3.3 3.3
Earnings/Hour (dlrs) 26.55 26.43 26.39 26.39 26.36
Pct change 0.5 0.2
Earnings, Hours of Private, Non-Farm Production workers:
Sept Aug (Prev) July (Prev)
Avg Weekly Hours 33.6 33.6 33.7 33.7 33.7
Earnings/Hour (dlrs) 22.23 22.14 22.12 22.09 22.08
Pct change 0.4 0.2
Non-Farm Month-On-Month Payroll Changes by Industry (1,000s):
Sept Aug (Prev) July (Prev)
Total Private -40 164 165 133 202
Goods-Producing 9 66 70 -20 23
Construction 8 19 28 -9 -3
Manufacturing -1 41 36 -11 26
Service-Providing -49 98 95 153 179
Wholesale Trade 6.7 1.8 6.3 4.3 6.1
Retail -2.9 -7.3 0.8 -10.8 -1.9
Transp/warehousing 21.8 8.0 1.9 7.7 1.6
Information -9 -4 -8 -3 -4
Financial activities 10 8 10 11 10
Professional/business 13 43 40 43 50
Temporary help svs 5.9 7.5 0.1 12.9 10.1
Leisure/hospitality -111 0 4 50 58
Government 7 5 -9 5 -13
Aggregate Weekly Hours Indexes, Seasonally Adj. (2007=100)
Sept Aug July
Total Private (pct change) -0.1 0.2
Manufacturing (pct change) UNCH -0.2
Total Private (index) 107.3 107.4 107.2
Manufacturing (index) 91.1 91.1 91.3
Note--The indexes show total aggregate hours of production or
nonsupervisory workers on private nonfarm payrolls by industry.
HOUSEHOLD SURVEY-Civilian Employment, Seasonally Adj.
(Monthly change in 1,000s):
Sept Aug July
Workforce 575 77 349
Employed 906 -74 345
Unemployed -331 151 4
Sept Aug July
U-6 Jobless Rate (pct) 8.3 8.6 8.6
Jobless duration
27 weeks or more (1,000s) 1,733 1,740 1,785
FORECASTS:
Reuters survey of U.S. economists' forecasts for September:
Nonfarm payrolls +90,000
Private payrolls: +83,000
Factory payrolls: +10,000
Jobless rate: 4.4 pct
Average hourly earnings: +0.3 pct
Average hourly earnings year/year: +2.5 pct
Average workweek: 34.4 hours
HISTORICAL COMPARISONS/NOTES:
N/A-not available
The U-6 jobless rate measures total unemployment, plus all personnel marginally attached to labor force and total employed part time for economic reasons as a percent of civilian labor force plus all persons marginally attached.
The nonfarm payroll data is based on a survey of employers and the jobless rate is based on a survey of households.
from Marc Ostwald