You are using an out of date browser. It may not display this or other websites correctly.
You should upgrade or use an alternative browser.
You should upgrade or use an alternative browser.
ajaskey
Well-known member
- Messages
- 281
- Likes
- 12
SPX Following the Roadmap
The SPX continues to follow the roadmap I started in 2004 and update as time passes. Moves often end when the trend is broken and retested from the low side. This could happen in mid-June which is 90 days from the March low.
Other SPX Gannish charts can be found here : SPX Cycles with Gann Angles and Elliott Wave Analysis
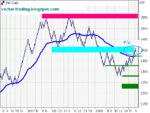
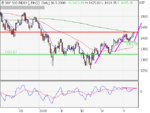
SPX Swingtrade analyse
MT trend - UP
Swing trend - Down
Pattern - Support Level
Indicators - neutral
Senti: neutral
Supports: 1.375 - 1.380 area, 1.320 - 1.330 area and 1.250 +-
Rezists: 1.425 - 1.435 area
Expiry Targets: 1.390 p.+- May, 1.430p.+- June
MP targets: 1.390p.+- May, 1.260p.+- June
Swing Trade Action - Sell Swing 1.425-1.430 area or Buy Swing 1.370-1.375 area
Attachments
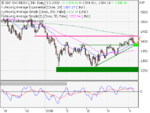
SPX swingtrading analyse
MT trend - UP
Swing trend - UP
Pattern - Rezist Level
Indicators - bullish, bearish divergence
Senti: extrem pozitiv = market corection probability
Supports: 1.380+-, 1.320-1.330 area and 1.250 +-
Rezists: 1.430-40area
Expiry / MP Targets: 1.430p.+- June
Swing Trade Action = Sell Swing above 1.430, target 1.405-1.410 area. Buy Swing at 1.380+-.
Attachments
Last edited:
hornblower
Established member
- Messages
- 884
- Likes
- 29
thanks for that vectorc
I was unable to find your blog
I think posting this way is a better idea
good luck with your trading
regards
hornblower
I was unable to find your blog
I think posting this way is a better idea
good luck with your trading
regards
hornblower
hornblower
Established member
- Messages
- 884
- Likes
- 29
thanks,
link is in post 1729 😉
I am sure lots of people would read it if it wasn`t hidden away !
can you just post a link under the chart every time
then we can go stright to it ?
Similar threads
- Replies
- 5
- Views
- 3K
- Replies
- 36
- Views
- 15K
- Replies
- 1
- Views
- 3K