Atilla
Legendary member
- Messages
- 21,115
- Likes
- 4,305
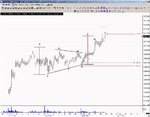
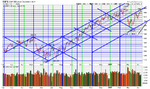
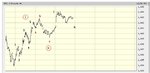
Bez said:Coming into that 16:10 (11:10) turn window .....
EDIT:
Wel that side ways chop hints its wants to invert ( today is a orange day 1 of the cycle) we can have an extra point between in lunch....
Hi everyone,
I'm back again and your predictions are spot on Bez. With oil falling I'm not sure SPX will fall by that much. I also feel expectations of what's coming round the corner will cause some traders to sell off early perhaps. I don't know I'm just guessing as I feel like shorting ahead of 1445-50 which is where I'm still expecting SPX. (Mixed up kid 😱 )
And so I have at 1441.6. Small entry for now. See how it goes. No SL at the mo as I can imagine SPX going through the roof. For target 1435 sounds good and ambitious. I might take half or all profits at 1436.5. Don't want to be greedy. :cheesy: