You are using an out of date browser. It may not display this or other websites correctly.
You should upgrade or use an alternative browser.
You should upgrade or use an alternative browser.
frugi
1
- Messages
- 1,843
- Likes
- 133
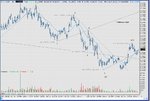
Clean geometry over last couple of days on the Dow. 3 pushes down to complete 5 wave pattern marks the bottom, as posted previously. However there are 2 equal retacements of 43 points, which could suggest a bigger wave 5 down to come following an ABC today off the bottom (a wave 4 taken together)? Could be 60 or 88 (wave 2 to 5 (3?)) points down from 10664 taking it to 10600 or 10576. I don't really do Elliot but do perk up a bit when the measurements are so clean. Joules?
On the upside there's a dubious Wolfewave target currently at 10714.
D'oh wrong attachment, sorry. Here's the right one.
On the upside there's a dubious Wolfewave target currently at 10714.
D'oh wrong attachment, sorry. Here's the right one.
Attachments
JillyB
Established member
- Messages
- 791
- Likes
- 38
frugi said:Clean geometry over last couple of days on the Dow. 3 pushes down to complete 5 wave pattern marks the bottom, as posted previously. However there are 2 equal retacements of 43 points, which could suggest a bigger wave 5 down to come following an ABC today off the bottom? Could be 60 or 88 (wave 2 to 5 (3?)) points down from 10664 taking it to 10600 or 10576. I don't really do Elliot but do perk up a bit when the measurements are so clean. Joules?
On the upside there's a dubious Wolfewave target currently at 10714.
D'oh wrong attachment, sorry. Here's the right one.
Very interesting post. My low was 10,569 and my estimated high 10,720, not a million miles from what you're suggesting. Does this mean we are getting a concensus?
User, what's your take on this?
Racer
Senior member
- Messages
- 2,666
- Likes
- 30
[BRIEFING.COM] August has been the worst month for the S&P over the last 15 years... Sure, going as far back as 1950, a flat performance looks better than a 0.7% decline for September, but with limited participation expected as many investors will be on vacation, thin trading volumes could make for a very volatile four weeks
User
Experienced member
- Messages
- 1,170
- Likes
- 23
User, what's your take on this?
My take is similar......upside expectation to 10700 or maybe a little higher for Tuesday.......
The end of today's session was poor once again......
No point in chasing a dangerous small-limited upside gain.......better to sit it out and wait for the short entries......
Infact my stat that we could see a bounce for the S&P as it lost more then 0.5% on Friday coupled with a decline of more than 10% on the volume in comparison to Thursday is now complete as the S&P ended higher today......poor but still up.....
So I would like to sell higher prices.......10700 would be nice but I'm not sure if we will see it....
Does this mean we are getting a concensus?
Thats the problem.......consensus normally gets it wrong......
So I wouldn't wait around 10700 as 10699 maybe be good enough......get my drift?
AAII Bullish Consensus 55% or higher on Up Week for S&P500
Which is what happened......
So the chances of a lower S&P500 weekly close over the next two weeks is 70%.......
We have been seeing definate distribution.......
The problem is we could chop around up and down......but the 'big move' will be to the downside and it should be massive......
When will it occur we can only analyse with the information at hand......
frugi
1
- Messages
- 1,843
- Likes
- 133
Racer
Senior member
- Messages
- 2,666
- Likes
- 30
frugi said:
Something very bullish I hope 😉
Haven't closed out all of my longs yet.........
Oh it isn't..... ah well, got to live with that 😈
Last edited:

Racer
Senior member
- Messages
- 2,666
- Likes
- 30
Racer
Senior member
- Messages
- 2,666
- Likes
- 30
NEW YORK, Aug 2 (Reuters) - Marsh & McLennan Cos. (MMC.N: Quote, Profile, Research) , the world's largest insurance broker, on Tuesday said its second-quarter profit plunged amid charges for restructuring, employee retention and regulatory expenses.
The New York-based company said net income fell to $166 million, or 31 cents a share, from $389 million, or 73 cents, a year earlier.
The New York-based company said net income fell to $166 million, or 31 cents a share, from $389 million, or 73 cents, a year earlier.
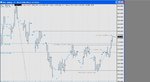
frugi said:and very clean geometry - again 🙂.
Interesting Stuff Geometry :cheesy:
Racer
Senior member
- Messages
- 2,666
- Likes
- 30
Annual rate in trillions of dollars; pct changes
are increases unless preceded by minus sign.
JUNE MAY APRIL
Personal Income 10.275 10.222 10.199
Pct. change 0.5 0.2 0.7
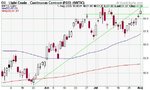
Personal Consumption 8.724 8.651 8.654
Expenditures
Pct. Change 0.8 0.0 0.8
Durable Goods 1.046 1.017 1.047
Non-Durable Goods 2.541 2.525 2.529
Services 5.136 5.110 5.078
Savings Rate 0.0 0.4 0.2
Look at that last line!
are increases unless preceded by minus sign.
JUNE MAY APRIL
Personal Income 10.275 10.222 10.199
Pct. change 0.5 0.2 0.7
Personal Consumption 8.724 8.651 8.654
Expenditures
Pct. Change 0.8 0.0 0.8
Durable Goods 1.046 1.017 1.047
Non-Durable Goods 2.541 2.525 2.529
Services 5.136 5.110 5.078
Savings Rate 0.0 0.4 0.2
Look at that last line!
Racer
Senior member
- Messages
- 2,666
- Likes
- 30
Racer
Senior member
- Messages
- 2,666
- Likes
- 30
Year over year, the price index for personal consumption expenditures minus food and energy increased 1.9% compared to June 2004. Estimates in past months were revised upward - the year-over-year climb in May was 2.0%, revised up from a previously reported 1.6%. April also climbed 2.0% year over year, revised up from a previously reported 1.5%. March rose 2.1% year over year, revised up from 1.6%. February climbed 2.2% year over year, revised up from 1.5%. January rose 2.2% year over year, revised up from 1.6%.
The Federal Reserve watches the PCE price index closely in its vigilance against inflation. The central bank's so-called comfort zone for the gauge ranges from 1.0% to 2.0%.
The Federal Reserve watches the PCE price index closely in its vigilance against inflation. The central bank's so-called comfort zone for the gauge ranges from 1.0% to 2.0%.
Similar threads
- Replies
- 5
- Views
- 3K
- Replies
- 36
- Views
- 15K
- Replies
- 1
- Views
- 3K