Trading the SPX

SPX Guess

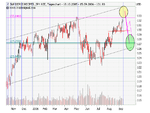
Sept 12th is 90 days from the June bottom. This is also the next 1/4 time line and a good place to watch for a rest. (Who knows what price level we will reach by that point? Maybe 1326?) Then 30 days later is Oct 12th which end the time box that just started and provide a good retrace from the current run.

sc
 
There seems to be a monthly cycle of sorts going on in 2k6. Apart from Jan we have hit some sort of high early in month usually within first 7d and then sold off. It seems to range from down 29/30pts to 72, 82 of June and may respectively.

IF this pattern holds we should see 1285/6 (or more) on this move down ?
I notice you have a light blue line in that zone. The same light blue line which also tagged the high at 1314ish - interesting.

The Hookster
 
Hook Shot said:
There seems to be a monthly cycle of sorts going on in 2k6. Apart from Jan we have hit some sort of high early in month usually within first 7d and then sold off. It seems to range from down 29/30pts to 72, 82 of June and may respectively.

IF this pattern holds we should see 1285/6 (or more) on this move down ?
I notice you have a light blue line in that zone. The same light blue line which also tagged the high at 1314ish - interesting.

The 1290 level (red line) is 180 degrees from the bottom and should provide support for at least a short period of time. That doesn't mean it can't spike down the 5/8 retrace line near 1285. Of course, that doesn't mean it has to do anything I expect it to do... :LOL:
 
9/12 is 10 business days from 8/28 when funds came in at 9:30 cst and bought all day,8/28 was 10 days from 8/16 when they came in and bought all day ,interesting to see at 9:30 cst if they unload thier longs or add to them
 
ajaskey said:
The 9/5 top was exactly 120 days from the 5/8 top.

The COMPQ/NDX, SOX, and INDU all bottomed in July. They all have 30 more days to go up if they want to without getting outta shape. I need to pay more attention to the NDX and SOX in my analysis.
 
You're probably right- usually are ........however can we really ignore 3mnths from june low, vxo near heading for multi year lows, indices at lofty levels, seasonal bearishness and potential resistance near by ??? You maybe right about next 30d I'm really hazy on that but over next 3d I see some slippage. The bullish case is so obvious it could be a decoy.

All the best
Hook Shot
 
Last edited:
Hook Shot said:
You're probably right- usually are ........however can we really ignore 3mnths from june low, vxo near heading for multi year lows, indices at lofty levels, seasonal bearishness and potential resistance near by ??? You maybe right about next 30d I'm really hazy on that but over next 3d I see some slippage. The bullish case is so obvious it could be a decoy.

I have not predicted anything. I just watch what is happening and point it out here. The market can drop just as easily from here without doing something strange. Markets don't go up more than 90 days in a row except when they are about to blow off. I've been watching the SPX mostly and that has been up for 90, but other majors have only been up for 60. A case can be made that the SPX really bottomed (higher bottom) in July also so it is only at 60 days up. That was my oversight and not a problem with the market.

As for a "decoy". The market is going to do exactly what it was going to do a year ago. The market as a whole knows what is happening and moves to where it should. (With the exception of a major disruption like a terrorist event or large earthquake). Just because we don't know what will happen to the economy next does not mean the market doesn't. Except for quick interday moves, nothing is random about price movement. The big money has long term plans for every penny it controls in the market. They don't change their minds based on today's newz. They know today's newz and are working to determine what the newz in the next year(s) will be.
 
Andy, I was probably being a bit hasty - I misinterpreted your comments.

I also concur with your views on big money having a larger plan.

Regards

Hook Shot
 
Howling at the Moon

Fall equinox, new moon, eclipse upcoming...

SPX hit the old high at 50% time squareout. A perfect price/time combo for a trend change.
sc


The longer term SPX chart hit the 1:2 price/time line which is to be watched for resistance until it breaks thru.
sc


The SOX could be waiting around for the 50% price/time point to make a move.
sc
 
Payroll withholding figures that are released daily by the U.S. Department of the Treasury are a surrogate for U.S. growth. Since the U.S. economy is dominated by service-sector jobs, taxes paid by those jobholders are a better indicator of activity than the month-delayed weekly unemployment numbers which dominate the media and political landscape.

So, chart of the relationship of S&P with payroll tax receipts. Interesting to note what has happened to those receipts lately.
 
SPX 1362 is 360 degrees from the 1219 bottom. Next week will be around 90 days from the move up starting in July. Probably a good level/time to take shorter term profits.

sc
 
kriesau said:
And your conclusion is that................................?

I conclude this is long term bullish. But short term cautious because of the natural tendency to pause/bounce from a significant price level such as the 6/8ths line.
 
tommorrow is 10 business days from last time funds came in as big buyers at 9;30 a.m. cst and bought big,the fourth timethey did this in a row without selling ten days later,watch to see if they start to unwind at 9;30,
 
Last edited:
Top