roguetrader
Senior member
- Messages
- 2,062
- Likes
- 49
SOX weak today, Nasdaq needs it to be strong to progress
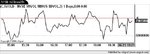
SOX back below 200 week sma
SOX back below 200 week sma
Joules MM1 said:......
To trade on purely one view is a risky practise. To trade purely fundamentally or technically or any specific way that excludes data, that may carry influence of some magnitude, however small, is to invite trouble in trade. .....
JillyB said:My basic rule (not to be broken) is.... trade what you see. TA works for me and I'm sticking with it.
roguetrader said:It is a great rule, and one of the most popularly quoted these days, unfortunately many following it only see what they want to see, which completely negates the principle.
Joules MM1 said:L DJIND at 10610 better break upwards out of this resistance
I wonder will that require some revision in light of Boeings cancelled Canadian order8:30am 06/24/05 U.S. MAY D
D.URABLES ORDERS GAIN LED BY AIRCRAFT ORDERS
roguetrader said:I wonder will that require some revision in light of Boeings cancelled Canadian order