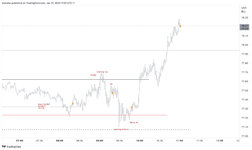
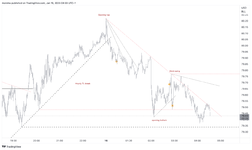
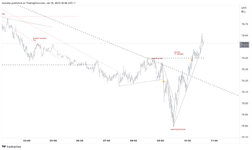
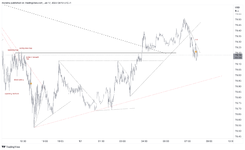
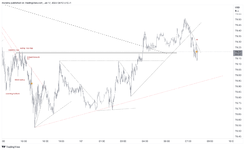
Trading the CL intraday using Wyckoff's method

moreina

Active member
Messages
117
Likes
2
Objectives:
Full-time job. Due to the time difference will be trading the Asian session and the first 2 hours of the EU session.

Style:
Swing trading intraday. This is defined as trading in the direction of the hourly swing, as well as trading the edges of an intraday range.

Timeframes:
1 minute and p&f chart for structure of the buying and selling waves, 5s chart for some of the entries.

Reversals, Breakouts or Retracements:
Retracements and reversals.

Trade Set Up:
Rejections and/or failed rejections of range edges. Retracements of trending moves in the direction of the hourly chart.
 
Dec.12

Hourly chart showing a slight upwards bias, 1 minute chart showing ranging action.
1670831131140.png

1670831184469.png

Trades to take will be rejections of the edges or retracements of breakouts of the edges. Resistance is defined however support is not.

Price breaks support but as the hourly is still pointing up we don't take the retracement of the breakout. A long is taken on the rejection of the lower limit which is quickly stopped out. The direction has now shifted down and we wait for a retracement to go short.
The short on the retracement is likewise stopped out, as price grinds higher before continuing down. We don't see an opportunity to re-enter so we wait for another (the last) retracement.
Price instead acts as if it's ready to plunge down, signaling the final leg down before a retracement on the hourly. A pyramid play is clear but as it's not part of the plan we don't take it and close up for the day.
2 trades, 2 losses, -39 ticks.
1670839609684.png

UPDATE:
Took 2 other trades at home.
Price rejected previous Resistance as it was retracing on the hourly. It quickly reversed but managed to scale out once near the bottom before the updated stop got it. It then proceeded to break resistance and so we took the retracement of the break out, as this now signaled that the new direction was up. 2 scale outs as price breached the trend line. First trade was worth only a few ticks but the second one yielded about 140 points.
Total end for the day.
4 trades, 2 losses 2 wins, net gain 111 ticks.
1670903570209.png
 
Last edited:
Dec. 13
Price entered a range after retracing the upswing on the hourly. Price did breakout of resistance but as it's the asian session we didn't take the retracement as the Asian session is notoriously thin and the only consistent trades seem to be reversals off resistance or support.
1670903789020.png

1670903814101.png

Nothing to do for now until price retests support.
Asian session action grinding higher, possible to retest the hourly resistance level of 75.38. As that's 100 ticks away, the plan is to try to ride a retracement up to that level or wherever the upswing will end, and take a short if it rejects that area.
1670916302226.png

1670916325379.png

Price retraces at the open and we immediately go long, which unfortunately is immediately stopped out. The last point of support is broken so this tells us to expect a retracement of the hourly swing. The rally gives us an opportunity to go short but we're still not familiar with the particular behavior at the turn of the hourly swings so we leave it and wait for the retracement to end and the upswing to continue.
As expected price breaks down but then forms some sort of a hinge. This behavior tells us that the retracement might turn into a reversal instead, and as we are familiar with hinge dynamics we wait for the breakout and prepare to enter on the retracement. The short is entered at the failure of the rally, 1st scale out at the higher low, and full exit when we start to get tired.
2 Trades, 1 win 1 loss, net gain 46 ticks
1670934012657.png
 
Last edited:
Dec 14

Price did retest the upper resistance area as postulated yesterday, and is now below it. The hourly trend line is intact though we still favor a decline from here.
1670987204876.png

The 1m chart shows a failed attempt to continue the upward swing and a possible direction change, all of which is still not visible on the hourly. Though it's generally better not to do any trades that are not bounces off R and S during the asian session, the failed attempt to continue upwards, as well as being directly below the hourly resistance zone gives the possibility of a major move downwards, and so we take the short opportunity presented.
1670987402986.png

Buyers reacted quickly once we entered the short so we exit right away and sit back and watch. Price is now trying to continue the previous day's upswing, and support has been established at the bottom. The plays are now buying rejections off bottoms that are above hourly resistance or shorting rejections of tops in any area.
1671005181035.png

We get our first opportunity as a resistance area is formed a bit higher than hourly resistance, and it coincides with a break of the upswing continuation. We go short on a rejection off the hourly but we're stopped out almost immediately. Price then retests the higher resistance area and we go short again but exit early as there seems to be a lot of hesitation as of the moment. We sit back and wait again for another opportunity.
1671009943808.png

Price rallies as expected but doesn't reach higher resistance and forms a half-assed resistance zone, as well as some micro support. We go short again on a rejection. This pierces the small support zone formed. We wait and see how far this goes.
1671011603005.png

Buyers immediately hit the ask and we're stopped out, then proceed to break resistance. Given that we've spent 2 hours ranging around hourly resistance, we anticipate a major move up and buy the retracement of the breakout on the 5s chart.
1671013092481.png

Trade was excellent, management quite poor. We didn't realize that the break of the trend happened at a previous top and thus was an exit sign, and instead we held the trade until it breached the last point of support. 60 tick trade turned into 12 ticks.
5 Trades, 3 losses 2 wins, net loss 25 ticks.
1671021057767.png
 
Last edited:
Dec 15
The overnight action seems to have reversed the upward swing. The 1m chart now shows us ranging after the downward thrust. We take a short on the rejection of the previous top.
1671085480444.png

1671085504972.png

Price drops back to support as expected and we exit as soon as we see a rejection.
1671087868860.png

Shortly before the open we see another rejection of R so we take another short. This travels all the way through S and actually breaks out. We close as it retraces and get ready for another short at the end of the retracement.
The next short gets stopped out quickly and price retests R. We go short on a rejection only to have it quickly stopped out followed by another rejection so we re-enter. This one again goes all the way to the bottom and we're confident that a new short swing is in play.
Instead, price starts to range and by the time that becomes obvious and we close price is all the way back to R so we can only get a few ticks off that trade. It then bounces off a previous top, slightly below R, and we go short once again. This one gets stopped out and price actually breaks R and and signals a reversal of the hourly swing as it also breaches the upper limit.
We go long at what seems to be the end of the retracement and get stopped out. Price then rejects off a previous bottom and we go long again. We get stopped out again but like the previous short off R, this once rejects once again off the bottom so we try again. This time price goes all the way up and we have a start of a new upward swing.
We are now in trade management mode.
1671098476187.png

We full close at 76.5, not for any technical reason but because it's time to go home.
9 trades, 4 wins 5 losses, net profit 94 ticks
1671104142440.png
 
Last edited:
Dec 20

Price is ranging after yesterday's upward movement. We looked at taking a long at a previous bottom but it didn't bounce and instead we go long on the bounce off the lower limit. If price breaks this area then we're looking at a retracement to go short.
1671516736058.png

1671516759904.png

We close here, not for technical reasons but because I'm wary of moves beyond 50 ticks during the asian session. The reversals can be vicious and by the time you spot them price has taken back all your gains.
1671518523267.png

Price reversed very close to where we exited and plunged down. We enter short on what looks like a retracement.
1671524183603.png

The short works well and drops 55 ticks from our entry point but then reverses without warning and signals a retracement on the hourly swing. We didn't spot any signs of a reversal and so did not manage to get out and we get stopped out. We will go long if price retraces slightly from here otherwise we will wait for a bullish swing to form before entering long.
1671526427819.png

Missed the valid retracement for the long due distraction so we've had to stare at the screen for over 3 hours before seeing another opportunity to enter long. The possible short on the retracement did not show any of the behavior that we've observed as predictable so we let that go.
1671538740269.png

We're stopped out almost immediately, but the downward move doesn't breach the previous low and we get another bullish spike, so we enter long again. It sucks but it happens.
1671541982208.png

Interesting action after the US open. Volume seems to indicate that buyers are absent at the top. We scaled out at the break of the trend line but rebought as it bounced of the last point of support. If price turns around and breaches it we will stop and reverse the position going short immediately.
1671545519004.png

Price does reverse the swing so we go short and cover at the bottom since it's clear that we're ranging.
1671546929593.png
 
Last edited:
Dec 21

We open the day with a short off hourly resistance. We now reject off support and flip long.
1671608635074.png

This is quickly stopped out and support is definitively broken. We know wait for an opportunity to go short off a failed rally or a rejection of one of the tops.
We take what seems like a failure to rally and are immediately stopped out.
1671610403329.png

Buyers take it higher and negate the bearish thesis, there was a breakout opportunity but we haven't tested it enough so we don't take it. Waiting for a retracement, which we get but didn't match the behavior we were looking for and we get left behind.
1671618260985.png

We get our opportunity for a long shortly after and take it. A bit early but it works out. We exit as we start to approach another major resistance point and we see major churn.
1671622842758.png

1671622860655.png

4 trades, 2 wins 2 losses, 70 ticks profit.
 
Last edited:
Dec 22
We miss the opening which would have led to more than a 100 tick move in our direction. We settle in and wait to see if we get a chance to get in at a retracement. The retracements don't give us the action we're looking for so we ignore them and are now watching for a chance to short the hourly swing retracement. Price instead forms a hinge and seems to break out out to the upside then quickly seems to reverse. We're now looking for a chance to go short on the retracement of the swing but price seems to bounce off the last point of support, so as to the plan we go long on the bounce. This is quickly stopped out but support is not definitively broken yet so we prepare another long unless price breaks down lower, in which case we will go short on the retracement.
1671712080100.png

1671712099189.png

Doesn't look like we're going to get a retracement here. Putting a note on the upper price action where the upward breakout attempt of the hinge ended up forming resistance, will be worth noting if this behavior happens on a consistent basis and we can take advantage of it.
1 trade 1 loss net loss -13 ticks
1671716003212.png

Spoke to soon and got a thrust up on the US open. We go short at the top, ready to cover at around 78.3 where the hourly support lies.
1671718170284.png

We scale out at a higher low, price then follows through and drops to the hourly support. It looks like a rejection and we flip long.
1671722265243.png

Price rallies but then stalls and reverses and we get stopped out.
3 trades, 2 losses, 1 win, net profit 50 ticks.
1671723085215.png
 
Last edited:
Dec 23
Price is starting to retrace on the hourly swing and we take a short on the rejection of resistance. This is stopped out right away and price proceeds to breakout and reverse the hourly direction.
Our first long is also stopped out immediately but the bullish thesis is not negated and the second try seems to be working out so far.
1671796124122.png

1671796143667.png

Price rallies past the prevous high then plunges straight down to the hourly point of support. We exit our trade with a small profit then re-enter long when buyers show decisiveness on the bounce.
1671801280554.png

Price forms a hinge, as well as support and resistance. We start to scale out on the lower high and fully exit on the rejection at resistance.
Trades 4, 2 wins 2 losses, net profit 40 ticks.
1671804507334.png
 
Last edited:
Dec. 28
Momentum has shifted to the downside as depicted by the clear break of the hourly support point and lower low.
1672215302018.png

Earlier we took a long at what seemed to be a bounce off support which was stopped out immediately. We have a paper short on the retracement because we're testing out a new entry criteria based on time instead of price levels, not yet part of proven tactics.
1672215386994.png

The paper short works out quite well, 75 ticks. The real short gets stopped out and we're back to waiting for another opportunity to go short.
1672219229346.png

Our second short failed as well but this was hurried, did not fit our plan. We've taken a third short and if this fails we'll call it a day.
1672222106318.png

This last short fails as well, something else is going on and we call it a day.
4 trades, 4 losses, -70 ticks
 
Last edited:
Jan 4
Hourly has shifted down on yesterday's action. We take a short on the assumed continuation of the downward swing.
1672793251078.png

1672793273129.png

Price rallies and takes out our stop before immediately reversing and breaking the new upward stride established. We take another short on the retracement using a 5m trigger.
1672799923851.png

We start to scale out on the higher low and move our stop to breakeven.
1672809305933.png

Price drops down, retraces, then proceeds to drop down more than 140 ticks from the last retracement high. We're now entering oversold territory and since we're now up more than 70 ticks net, including the previous loss, we close our short and see if there's an opportunity to take a countertrade on the long side.
1672820408646.png

The long goes nowhere so we exit early and re-enter our short. The first try on a 5m trigger gets stopped out but as the intermediate trend is still down we go short again, this time waiting for a lower high.
1672827931019.png

We close our short for no technical reason other than it's time to go home for the day.
5 trades, 2 wins 3 losses, 96 tick net gain.
1672829638205.png
 
Last edited:
Jan. 5
Day started out with some finnicky price action. We're in the middle of a retracement on the hourly swing and we take our first short as price rejects of the previous day's resistance. This is stopped out but price then proceeds to break the upward stride so we're still short, and go short on the first retracement. This too is stopped out but our analysis is still on towards the short side, and we take another short off another rejection of resistance. Again this is stopped out so we now suspect a flip of momentum towards the long side.
Price then breaches the upper limit so we go long on a 5m trigger, which is then stopped out again as price rejects off the hourly point of resistance.
4 trades so far, all losers.
1672904117526.png
Our next short is on the retracement of the rejection off hourly resistance, which is also taken out. Price is now ranging.
1672904219038.png
 
Dec. 6
Price looked to continue down yesterday but then pulled up during the US session. We are now nominally bullish though the trend is still neutral as we haven't made a higher high on the hourly.
1672994236614.png

We looked to go long during the asian session at the retracement but price immediately pulled down and started ranging. We trigger our second long at a bounce off a previous bottom but this failed as well. Price bounced on the next bottom and we go long for the 3rd time there.
1672994325702.png

Price forms a lower high but as it's in the middle of nowhere we don't exit and wait to see if price breaks through the temporary support area where we went long. It does and then proceeds to bounce at yesterday's support. Here we go long again on the bounce.
This time price rallies through the previous tops, forms another lower high (again we don't exit as it's in the middle of nowhere and this time it continues), and then proceeds to bounce off the high created where we went long in the beginning of the day.
4 trades, 3 losses, 30 tick net gain.
1673001881063.png

We ended up taking two more trades, 2 longs. One is stopped out, the second is a re-entry that runs all the way to hourly resistance.
6 trades, 4 losses, 2 wins, 110 tick net gain.
1673013354580.png
 
Last edited:
Jan. 9

Hourly still ranging, price rallies to the top of hourly resistance and forms what seems to be a lower high and we go short.
1673247741892.png

1673247779461.png

The lower high is confirmed but a rally immediately makes a higher high and takes out our stop. We wait for another failure to rally to re-enter our short or a breakout and a long on the retracement.
1673248228006.png
 
Last edited:
Jan.10

Price has reversed from yesterday's action is now in a bear swing. We see an opportunity to go short on the 2nd leg of a swing and take a short on a 5m trigger.
1673333646043.png

1673333668711.png

The short worked out nicely, if we don't retrace before hitting 73.3 we will close on the first sign of trouble.
1673337629962.png

We move our stop closer and after a nice 60 tick drop price rallies aggressively and takes out our new stop. This is unfortunate because it immediately rejects the last point of support, at which point we re-enter our short.
1673339339476.png

The call is good but we placed our stop lower than the danger point because it surpassed our risk tolerance. The stop gets run over but then price fails to form a higher low, prompting us to re-enter again at a lower high. Price drops and forms a higher low, at which point we exit.
1673341711447.png

The hourly has shifted direction and we go long on the first retracement.
1673348585187.png

The long didn't last long and we immediately start a countertrend down. We enter another long on the bounce off support.
1673359212522.png

We pyramid our long on the HL.
1673359519946.png
 
Last edited:
Jan. 11
Hourly is ranging, and we open within a range created by the Asian session. We buy the opening bottom, which takes us out of the range but the breakout is not confirmed. We flip short at the start of the selling wave but get stopped out immediately as price moves higher and we re-enter our long at the 1 minute retracement. We scale out one contract on the break of the demand line.
1673428952373.png
1673428930571.png

We close on the next break of the demand line.
3 trades, 2 wins 1 loss, 60 net tick profit.
1673429948641.png
 
Jan. 12
Hourly is bullish with with the immediate trend ranging.
1673506728719.png

On a micro level we're ranging though resistance seems to be broken. We wait for a bounce of a bottom or a higher bottom to go long.
1673506790594.png

Price bounces off support and we go long.
1673508049331.png

Price forms the opening top at a previous top and we flip our long short, It then breaches support but fails to break out, forming the opening bottom, and we flip our short long.
1673513821074.png

Buyers take price past the opening top. We wait for the bottom of a selling wave so that we can move our stop and lock in profits.
1673514734760.png

Oil is doing a runner, we're now more than 100 ticks from the swing long with no selling wave in between so as soon as we see a higher low we'll close out the trade.
1673516923321.png

No selling wave in sight and we need to close up shop so we're shutting it down here.
1673517743694.png

4 trades, 4 wins, 113 tick net profit.
 

Attachments

  • 1673517784958.png
    1673517784958.png
    139.7 KB · Views: 26
Last edited:
Jan 13
Intermediate trend is bullish but the micro scenario is ranging. We take a long off support in the Asian session which we prematurely close on a rejection off resistance, prematurely because the intermediate trend is long so the plan is to hold unless there's a definitive lower high off resistance.
We then take a short off the opening top, our stop is hit but price forms a micro lower high so we re-enter. Price drops then reverses and we go long off the opening bottom. Traders then take it back to the opening top and just sit there, we exit on a thrust down. Overall a nothing day, the money maker would have been the first long in the Asian session.
4 trades, 3 wins 1 loss, 4 tick net profit.
1673603167126.png
 
Jan. 16
The hourly stride is up from the previous day's action but the opening forms a top and we go short. Price then breaks the stride and forms a bottom. The distance isn't meaningful yet so we expect a resumption of the upward trend and we go long on the bottom. Buyers refuse to follow price up and our stop is taken out. The break is now important and we expect price to retrace higher before breaking down.
1673840002046.png

1673840016775.png

As this is the Asian session we won't re-enter our short and instead choose to go long on the rally and then subsequently flip short if the rally is weak, confirming the new price direction
Price breaks the hourly last point of support, retraces slightly, and continues down on the European open. We go short on the lower high.
1673856723960.png

Price forms the opening bottom but we don't flip long here because we don't expect an hourly retracement at this juncture due to the fact that the opening top formed the retracement for the hourly support break.
1673858675268.png

Buyers take it all the way up to hourly resistance and trigger our stop.
1673860330572.png

The hourly stride has been broken so our new direction is up. We take a short on the beginning of the hourly retracement with the plan to close as soon as we see that the retracement is over and buyers take over.
1673874785173.png

We close on the higher low.
3 trades, 2 losses, 1 win, 15 net tick loss.
1673875198349.png
 

Attachments

  • 1673840089052.png
    1673840089052.png
    191.5 KB · Views: 28
  • 1673861822848.png
    1673861822848.png
    188.9 KB · Views: 24
Last edited:
Jan.17
The Asian session is retracing the hourly downward swing. We wait for a lower swing or break of the demand line to go short
1673939545506.png

1673939827797.png

Price forms a bottom at the open and we go long, with the idea of flipping short on the opening top.
1673943717356.png

Buyers took it all the way to hourly resistance before it came back down to where we started. Unfortunately we didn't spot the reversal signs we were looking for and turned a 60 tick profit run into 1 tick. We make a higher bottom and we go long again.
1673949675100.png

The long still has room to run, but we close here as it's time to go home.
1673950977940.png

2 trades, 2 wins, 26 net tick profit.
 

Attachments

  • 1673939610320.png
    1673939610320.png
    210.9 KB · Views: 24
  • 1673939529716.png
    1673939529716.png
    210.1 KB · Views: 26
Last edited:
Top