Trading the CL

moreina

Active member
Messages
117
Likes
2
Thought I would do start this journal anew. Been away for a while journaling on a discord server but it would be good to get some interaction from "pure" price action traders.

Will be posting some of the journal entries of the past few days one after the other to get populate the thread.

Sep 22 EU

Premarket

Hourly has shifted momentum. Though the 15m swing high hasn't been breached, therefore the trend technically is still down, I'm not expecting any rejections to the downside to do much, at least until we hit R again. Line of least resistance for now is up and rejections will be taken that go in that direction. The successful rejection of the range MP to the upside confirms the current direction.
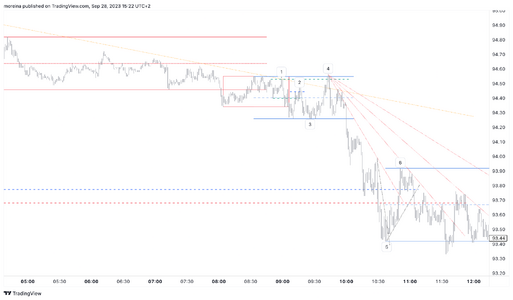
1695892632445.png

1695892682019.png

1695892703376.png


How it unfolded.
1695892734585.png


  1. Price opens in the middle of the premarket range, nothing to do here but wait to see what happens.

  1. Traders take it down, so we extend the MP and wait for price to retrace to that level. This happens but we don't see any serious selling activity, so we pass on the short.

  1. Buyers step in at a lower MP but we don't go long as this would now be countertrend and these have a tendency to fail. Price does make it all the way up to the previous MP though.

  1. Here we see buyers just give up and selling starts to step up. This is what we've been waiting for. We enter short and price just falls. Scale out at MFE. We then set the close out order at the ONL but traders start to act a bit funny at the lower MP. Sellers disappear and buyers are in. We close it out here. We would go long but wouldn't have time to manage the trade.
 
Sep 22 US
Premarket

Hourly working its way to PDH to continue the upward swing.15m forming a range at the previous swing point that started the retracement yesterday. Broke out of the downward swing during the EU session.

1695892866816.png

How it unfolded.
  1. Price opens at the highs so even though all the major and minor movements are in sync we wait for a RET to get long. We get that shortly and price rejects the MP so we enter long here.

  1. Grindy action on the way up then we see sellers step in with some intent at the ONH and our line is broken. We stay in because of the overall trend and because we know that this kind of thing is normal at the highs. Price does look like it's going to continue up as the rally after the break supersedes the MAE but we move our stop to the low just in case. Traders reverse course and we're out.

  1. Bounce above previous R but we don't really see any serious buying happening so we sit still.

  1. Another line break at the ONH with serious selling. Rally again supersedes the MAE but price rejects right at the ONH, and it's a lower high. We enter short but scratch the first trade when we see some buying activity, which would validate the MAE warning. Traders however again quickly reverse course, so we re-enter the short. We exit completely at the MP and call it here.

1695892915752.png
 
Sep 25 EU

Premarket.
Weekly: unchanged.
Daily: had a bit of a retrace but still bullish. If it re-enters the channel then we could see it fall until the MP of the channel which is about 85-87, depending on when that happens.
Hourly: A bit more interesting here. Price refused to drop below 88.37, so the area between 88.37 and 88.97 is now a potential support area. Traders also refused to go above 91.33 so the area between 91.33 and 91.07 is now a potential resistance area. The midpoint of this chop area is also the same midpoint as the previous down move so that's interesting..
15m: Price has also further compressed here and formed potential S/R denoted by the yellow box. We've marked the MP and the edges.
5m: Some more price compression here as we have a premarket range and price is currently in the middle of it. Range and MP marked.
1m: What the landscape looks like. Given the trendlessness of the hourly, 15m, and 5m we're paying attention to numerous edges here and we'll probably be dependant on higher lows or lower highs rather than straight out rejections as there is no intraday trend so no high % trade on a pure rejection.
1695893019631.png

1695893035207.png

1695893044337.png

1695893054340.png

1695893065314.png

1695893081956.png

How it unfolded.
How it's unfolding.
  1. Price opens as range R was rejected and pushes down for a little bit before buyers step in and push it back up to R. Sellers come in and push price all the way back to the MP. Range is narrow, and price isn't trending on the intraday so we don't participate.

  1. Buyers step in at the MP and break the stride. Again, price is ranging on the intraday and the range is narrow. The extreme we're looking at is the ONH and ONL so we pass on this one too, though in hindsight it would have yielded some nice profits.

  1. This is what we wanted. Though price did follow through after the ONH breach, it's only been one leg so far and now sellers come in a the top and break the buyer stride. Buyers come in at the swing low but sellers force a lower swing high. We wait for price to print a lower low before entering short.

  1. Buyers step in just below the ONH. Normal so far and nothing to worry about. However at the lower swing high sellers don't show up to the party. We get suspicious and move our stop below this and lo and behold, traders take it and form another buying wave.

  1. Traders take it up to the lower swing low at 3, then again price drops with conviction. We're now below the ONH again, so we don't wait for a lower swing high and enter short on the lower low.

  1. Price here prints a swing low and lower swing high. On the static time chart it looks like one bar but in realtime the prints were there. We draw our supply line to track the trend.

  1. Buyers again show at the MP and sellers again are absent during the counter. When price drops again to the MP and buyers again show up we manually exit. Price isn't acting like we want it to so we don't want to be there.
1695893129299.png
We'll call it here until the US session. This is starting to look like price is just going to meander about for a while.
 
Sep 25 US premarket.

Not much change from the EU aside from moving the ONHL points and price forming a 5m trend. The defining characteristic here is that we're at the MP of the hourly range and price has formed a box in this area so this is an interesting area to watch during the US open as it could just rocket back up to R from here.

1695893194866.png

1695893203509.png

Price opens and continues the rejection of the 15m range MP started during the EU session. Nothing much to do here.
  1. Sellers step in at the top of the premarket chop area. We get a higher low swing with no participation then a sellers again step it up. Normally we'd short here but given the general trendlessness of the bigger picture and that we just came from the range MP we sit this one out.

  1. Misread the higher low and higher high at the ONL. We initiate a long that quickly gets taken out before price forms the actual higher swing low and goes in the direction we hypothesized. No RET whatsoever so we can't hop aboard.

  1. Lower swing high at the hourly range MP. We're not comfortable with this one either, we'd prefer to play the intraday edges.

  1. Second rejection at the same area as 3. We get to hop aboard this one but it starts to stall at the 15m MP so we quickly exit.

  1. At this point we've breached the PDL and followed through.. BUT... it's a one-legged follow through and price breaks its stride with buyer participation. We wait for the RET and enter on the higher swing low. Scale out at the MFE and full exit at the break as price reverese again the 15m MP. We exit because we didn't see any buyers at that last swing low.
Done here, getting tired and the price action just isn't actionable enough for us.
1695893230484.png
 
Sep 26 premarket.
Hourly. In the lower quadrant of the chop area.
15m. Nothing much to add, also at the lower quadrant of the 15m chop area.
1695895053435.png

1695895098679.png

  1. Traders continue the premarket move and move price to the downside. It breaches the ONL, then hourly S before bouncing off the daily MP from the range a few weeks back. We see buyers get in and the stride break but we can't find a location to get long as there isn't even the smallest retracement.

  1. Buyers don't participate in the higher low.

  1. Buyers still not present here even as the selling wave is broken. We stand down. At this point we're able to draw out a chop area and extend the MP.

  1. Sellers come in as price pokes its head above the ONL. We start watching for the reaction so we can get long.

  1. Bounce off the chop area MP, as well as hourly S and we enter long. Except that for some reason we went in with 4 contracts instead of 2. We flatten as soon as we notice. We now try to get back in with our standard 2 contracts and sell participation at the higher low. Unfortunately this doesn't go very far. We're now in another chop zone.

  1. Sellers are coming in at higher prices as price makes a higher top then is pushed down. We're watching for a bounce off the MP now.

  1. Price rejects, but it's gone a ways down, more than it should have. We're so focused on this that we fail to notice that price put in a double bottom which would have validated the initiation of a trade. Instead we watch what happens next.

  1. Sellers again showing up at higher prices but the rebound happens without conviction. We call it here as we're starting to lose focus.
1695895141843.png
 
Sep 26 US premarket
Hourly. We've breached the chop zone and even without follow through the chances are high that a rebound here will reverse at the chop area MP because this hasn't proven itself to be a trading range yet.
15m. The picture here is pretty much the same except that if we reject here we almost definitely be in a range.
5m. We're watching the premarket range S or MP for the catalyst for a rally up to the 15m and hourly MPs.
1695895237460.png

1695895265995.png

1695895280718.png

  1. Price bounces off the MP premarket and opens at the top of the swing high. It then moves down before rebounding and making higher higs.

  1. Sellers reject the premarket MP, we enter short on what looks like a lower swing high, but prices ends up making higher highs.

  1. Stride is broken and we're still at the MP. We re-enter the short on a lower low. It barely makes it past the last swing low before rebounding.

  1. Price gets past the MP but starts to form a lower swing high. Again we re-enter at what seems to be the lower low but price ticks up and takes out our stop before moving down.
Not taking our usual trades because the 15m is ranging, but it seems that within the larger range it still makes sense to follow the smaller 15m moves as they still yield good profits.
1695895316613.png
 
Sep 27 premarket
Hourly. Price at R, possible re-entry into the range.
15m. Broke out of the 15m range, now heading down. Possible RET for further upside.
1695895382680.png

1695895393839.png

1695895416934.png

How it unfolded.
  1. Price opens at the edge of Hourly R and rejects. We don't see any serious buying activity so we stand down.

  1. Classic rejection at premarket range MP. With serious intent. We initiate a short here.

  1. Traders take it up to R where again it bounces on what seems to be nothing. At the higher high we exit as price isn't acting right.

  1. Another rejection with what seems to be intent. Technically correct, but we shouldn't have shorted here as price had previously formed a higher bottom. We get out for a small loss.

  1. At this point price has rallied up to the ONH where it forms a top. This allows us to draw a range. We don't participate because we don't see enough of a push downwards from the top. We misread the bounce off the MP, serves us right for talking on the phone. Small loss here as well.

  1. This is the money. Strong rejection at the reverse MP, we enter long and front-run the line break. We fully close at the higher low as again price isn't quite acting right. We start to surmise that we're going to range rather than trend upwards.
1695895437745.png
 
Sep 27 US
  1. Price rejects the high from the 19th premarket and forms a lower swing high. This was just too tempting. We initiate a short premarket. Doesn't really go anywhere but we got 20 ticks out of it.

  1. Price now opens and rallies to the top of the chop area and rejects. We saw this in real time and ticked all our boxes but as we don't really have enough samples of this particular trade, and the box is narrow, we pass.

  1. Price dropped down then rallied to the ONH. We now have a potential range so we draw it out. Traders look like they've given up so we enter short on the lower swing high only to have buyers step in and take us out. Price ends up forming a mini range at the top of the potential range.

  1. Price drops down and rallies off the range MP. Buyers participate. Nothing to worry about. We're still looking for an op to go short given the action that's happening, particularly that move down from the smaller range at 3.

  1. Rejection at R. AND SELLERS AREN'T THERE. No short. We actually opened up another chart and replayed this quickly because we wanted to be sure of what we saw.

  1. Buyers in at the MP. Now this is getting interesting. The absence of sellers at 5, after pushing price down at 3, and buyers showing up here at the MP. Market is telling us that it doesn't want to go down and it's planning a serious attempt to push higher. We actually broke a our own ruler here going long, not a technical rule used for entries, but a strategy rule. We haven't studied this particular situation enough, don't have enough samples. So even though it worked out this goes into the "I broke my rule" bin. However what made this particularly interesting to us is the real-time identification of shifting conditions. This has not been our best day by far in terms of profits but is definitely up there as one of the best days of trading because of the AHA moment.
1695895495507.png
 
Sep 28 Premarket
Hourly. Straight shot through R. What goes up most come down, at least a little bit.
15m. Same story.
5m. Two ranges visible here. S and the MPs may be interesting areas for upside continuation. ONH should be watched for an hourly top/bottom to form, as this is where it frequently occurs
1695896623297.png

1695896634021.png

1695896645195.png

Sep 28 EU

1. Traders reject the last high formed premarket, putting us temporarily in a possible chop zone. A quick dip down into the box edge and rally up to the box MP.
2. Another rejection here. Traders seem to want to go down.
3. Price turns at the previous low but without any significant buying activity, there's no eagerness here.
4. Rally up to the opening high, and sellers again step up. This is a clear sign now that price will probaby retest the low at 3 and may even drop further than that.
5. Price drops all the way to ONL after a quick bounce at the premarket range MP. Here we see some buying, and the stride is broken. Downward move is over temporarily and an hourly bottom may form in this area so it bears watching.
6. Selling wave at the premarket range MP. Nothing very conclusive here, so we watch to see if buyers step in again at the ONL or at the bottom formed at 5. Price does get all the way down there and buyers step up once again. This is looking more and more like an hourly bottom is forming. Price rejects the range MP once again but that's not really concerning us at the moment. Then on the retest of the lows at 5, buyers disappear, vanish, exit stage left. The hourly bottom possibility evaporates and we start to think that a downward continuation is likely.
7. Price drops past the range lows and rallies up to the range MP. And sellers appear. Clear sign that prices will likely go lower from here.
1695907405034.png
 

Attachments

  • 1695907366360.png
    1695907366360.png
    205.6 KB · Views: 6
Last edited:
Sep 29 EU premarket
Hourly. Retesting the breakout area. Critical to see what price does here.
1696147512280.png

15m. Stride kinda broken but not in a decisive way.
1696147548957.png

5m. Price is bouncing between the premarket range MP and the 15m MP.
1696147574694.png

How it unfolded
1696147597552.png

  1. Traders reject opening S and the box MP and push through R (green dashed).
  2. Selling here and price retests opening S.
  3. Buyers step in. So far so good, looks like a bullish movement is developing and a swing forms.
  4. Selling at the MP. This causes price to make a lower low and tests the ONL. Hmmm.... ok we want to see if support at 1 or 3 is going to gel flipped.
  5. Buyers step in at the ONL.
  6. Sellers in at the support point at 3. Looking like it's going to flip after all, but there's a last minute save and buyers instead flip resistance.
  7. Retest of R and traders participate. R flipped to S. Price should make a serious attempt to go somewhere from here.
  8. Selling participation and a lower high, at the same level as 2. Could be a range forming here. Buyers are present at the lower swing low but price proceeds to make an even lower low after that. We now have the opposite situation as in 6.
  9. Buyers are in. Last chance. If there’s some sort of rejection at the level at 2 then we’re definitely ranging.
  10. Rejection. Ranging.
And with the range drawn in after 10.
1696147623239.png

A closer examination of the action between 5,6,7 and what I was looking at. Action before this showed no one had yet "flipped" a swing point where there was concentrated action. So although there are a few swing points broken, those swing points didn't have active participants. the flip of 6, and subsequent retest at 7, gave me some directional sense.
 
Sep 2 premarket
Daily. Trying to accelerate.
Hourly. Broke the downward stride but a bit meh. No real force behind it.
15m. Potential S is PDL, potential R at the hourly top previous day
5m. Ranging.
1696224985714.png
1696224998641.png
1696225011469.png
1696225030144.png
 
Previous post should have read Oct 2 premarket...


How it unfolded.

Price opens and immediately forms an upper level right where the ONH is.

1. Buyers make an attempt to rally but sellers step in and reject the previous swing with buying activity. Swing flip. We enter short here. Price falls for a bit but then forms a buying wave. No buying activity but we prefer to exit and re-enter.

2. Sellers come in at the top with no buyers beneath. We re-enter the short. This goes all the way to the ONL.

3. Traders reject the ONL and reverse the last selling swing. We initiate a long here and fully exit as what appears to be a strong selling wave forms.

4. Price actually manages to get all the way to the previous level formed at 2 where we see another rejection with selling activity. We enter short but close as price starts to chop around.

5. Price falls out of the box then rebounds to the chop MP. As sellers participate we re-enter short. This goes to the premarket range MP, turned level, and we exit as the last selling swing is breached. No buying activity below though.

6. Once again a rejection at the level at 2. We enter this a bit prematurely and get stopped out on our first attempt but promptly re-enter on the lower swing. We bail as price seems to stall.

7. Price falls down a bit then rallies, again seemingly with no participation. We re-enter short. In hindsight, as price had failed to breach the previous bottom formed by 5, we shouldn't have shorted but we lost track of the bigger picture. Stop out.

8. Buyers are flipping sellers. We enter long. This goes all the way to ONH where we exit at a rejection.

1696248992400.png

Chop city today but we managed to get a nice return on our trades.
 
Oct 3 Premarket
Hourly. Dropped out of the channel and at previous S.
15m. Broke its stride.
5m. Potential S at the bottom and almost definite R at the top.
1696310704691.png
1696310766483.png
1696310817322.png
 
How it unfolded.
1. Price opens and rejects the premarket MP and breaks opening S/R. Buyers step up but are quickly pushed down by sellers. Buyer/Seller flip. We initiate a short though we expect this is to be short-lived as the intraday trend is up.

2. Buying activity and the line is broken. Price rallies but no selling activity at the top. As buyers make their appearance at the swing bottom we flip the remainder of our position and enter long.

3. Lower top, as compared to 1, we fully exit.

4. Price manages to rally past and follow through before forming a lower swing high with selling activity. We enter short but are quickly stopped out.

5. Price reaches potential R and forms a top, but no selling activity at the top so we stay put. Price then forms a higher bottom but at the top sellers immediately flip the swing point. Another buyer/seller flip, with a lower top. We enter short. Exit as sellers are quickly overcome on a higher swing low.
1696323848525.png
 
Top