Trading News with S&R

THANK YOU !

it will be a few hours as there are things to do and limited time to do them but i shall place everything on the table for examination.

as far as "sidestepping" bear, i was not aware that was your reaction simply because i do not fully understand what youre saying --- what to you is fine english is to me a difficult translation !

to split, I once again state that if i EVER said 1000% profit, it was a mind fart of the greatest degree ---- i do very nicely thank you, but would probably be dead if i worked to achieve that number !

you guys will prob be in bed, with yourselves or someone else, by the time i get to posting this tonight, so talk on ya in the morning (here) which will be around dinner for youse peeps !

Thnx bunches

mp

You are so indignant that you MUST be right :LOL:

So I'll apologise for the extra zeros!

I've been trying to find where I read that for the last 15 minutes and give up, you are so prolific.

Split
 
WORK IN PROGRESS

dont complain till its all written out, but got home late and will talk about it later

AND YES I KNOW that zigzags repaint, AND ITS DAMN GOOD THAT THEY DO !

this story and others to follow on tomorrows tide --

btw split --- IM PROLIFIC !!!!!!! --- i got a measly 270 posts to your 2240 or so ---- wanna rephrase that ? (LOL)

mp

What youre seeing are two DAILY charts of EURUSD which are designed to tell me different things -- although I rarely trade the daily timeframe, the first is a trading chart and the second is a trading'/research chart.

the second chart shows trends, reversals and (by using my little macd, ma x-over indicator thingie) some soon to be reversals.

normally i use the same as everyone else, fibs, support and resistance, trend and time of day (for the reversals) although one cant pick up all that info in a daily chart. (ill get to intraday a bit down the road)

For me the most impt thing is the LRC, which so VISUALLY identifies every trend the currency is moving through, be it on the daily, weekly, monthly or one minute --- doubtfull i could trade without them at this point.

for split --- ive been talking with the shareholders and they may allow me to release "one" brokers statement from what we refer to as the "beer hedge" --- its a simple hedge, taken on GU at news releases and specific times of day and since its not top priority, but "beer money" we only try to average $1000 USD a day, which seems to be pretty consistent. THIS may be the 1000% figure you thought you saw !

For total pips per day, I am at a loss ----- our "revenue" people here do not accept "pips" but insist on cold, hard cash, so my records are set up to record money, not pips ! (i seem to remember someone telling me we made 680 pips one day, but i have never checked to see if that is low, high or normal !)

I tend to look at my thumbnail charts(see the watchlist, where the blue squiggles are the "thumbnails of the days action) of all the pairs which is contained on a completely different set of charts with a feed from Barclays and most of the time i choose to trade the ones that are moving the smoothest -- why add to the fun of trading by choosing a bucking bronco, when a 5 gaited saddle mare will get me to the same place ? Having said that, EURGBP and USDJPY are two favorites --- EUR for its really high rate of return and UJ because it takes so little in equity to make a decent profit.

This days thumbnails were all pretty standard, with fridays profit taking in evidence --- the flat ending part is due to no trading on saturday !

One of, if not THE, most impt charts is my 10 day 240 minute chart --- this allows me a detailed look at what direction the currency is moving in, and by examining upcoming news along with direction of the currency, it becomes a pretty simple job to determine which direction the price will be going IN THE 240 MIN TREND --- that is not to say it will not move up and down a lot, BUT with only a small amount of practice, one can usually tell exactly what the currency will be doing --- to get more specific, one goes down to the lower timeframes on the 10 day chart and can project what the intraday movements should be. Im attaching one of those charts, and ill try to clean it up alittle because bears eyes cant handle that many lines (joke bear !)

GBPUSD is my "hedge" play because of its great day range and while i can trade it reasonably successfully, its just too much like being at an amusement park in one of those "shake em up, turn em upside down, whip them across the room" kind of rides for this stolid pipe smoking and stogy kind of guy ! I do play it often, but usually i just sort of look at it when i feel like it and if i see something that looks nice, ill grab it for a while, but deep down i just dont like its moves, even though it always ends up where its supposed to !

NOTICE on most of the charts, i have the Linear Regression Channel or the DeMark channel (they do slightly different things, although very similar in appearances) ---- on the 480 min/10 day (im using that tf to simplify the chart, which would normally be a 240 min, and to cut down the number of candles on it), please note how the price moves from the top channel to the bottom channel and then bounces up again --- during this process which is inevitable, there can be a stop for a "rolling" consolidation at the MIDDLE LRC for often up to a week, but after the consolidation, the currency then moves to its next channel point.

WHILE YOU WILL NOT BELIEVE THIS, if you carefully examine the movement of the currency and where it "paused" for consolidation, we will see that it "arrived" at the correct LRC point at exactly the same time as the news did --- other words, the banks are simply "holding" the currency in one spot, waiting for the time to release it when the news is coming !

the last chart is my 0.000016 range chart, which i use as a companion chart to my normal short term charts (1, 5, 15, 30 and 60(both for trend) --- its purpose, while i can trade from it if i choose, is to alert me to when there will be a movement either up or down in my other charts --- knowing when the currency will drop on the 5 minute can allow me to take profit or in this case, since i would have been short, SEE EXACTLY when my 5 min chart will start moving to the upside. I then, knowing it will hit the middle LRC and bounce down, REMAIN in the short, without a stop loss (which would probably be hit at any one of the upside moves) and take profit on the short when i feel like it, and NOT when the stoploss takes me out. Now i will grant you, this is a very clear and classic short situation, but not all are so picture perfect --- for them, with the price moving up and down, KNOWING where im heading is what allows me to hold the short with no sl.

I use overlays, bollingers (aqua lines) and support and resistance (purple lines) and a few "predictive" overlays so im aware of where we are going --- NOTE that the aqua bollingers on the 480 chart is heading down, and below that is support at 1.5805 --- we can fairly safely predict that we will hit that point at least, and below that is the bottom LRC at 1.5801. Now, I cant tell anymore from this chart, as i will have to see if there is a breakdown at the 1.5801 area, so now i have to switch to my daily and weekly chart to see if theres any more information available !

And yes, on the daily chart I see the bols is at the 15% fib, looking fat, dumb and happy, so my mind starts to think maybe i should short this longer, huh ? Switching over to the second chart, the combo trading/research chart, i see that the price has topped (see the zig zag and its arrows pointing down? AND my MACD (purple line) has diverged its little heart out and is pointing downward as if the viagra has worn off --- roughly speaking, we gots a short developing like a storm off of florida in the summer !
 

Attachments

  • eurusd for T2W   bols, s+ r, trend arrows.jpg
    eurusd for T2W bols, s+ r, trend arrows.jpg
    237.1 KB · Views: 183
  • eurusd for T2W    piovots + support chart.jpg
    eurusd for T2W piovots + support chart.jpg
    250.6 KB · Views: 169
  • 10 day  480   EURUSD for split and bear.jpg
    10 day 480 EURUSD for split and bear.jpg
    277.5 KB · Views: 182
  • eurusd 000016 range chart.jpg
    eurusd 000016 range chart.jpg
    194.7 KB · Views: 164
  • thumbnails.jpg
    thumbnails.jpg
    95.3 KB · Views: 164
Last edited:
Mp,

You have my admiration, I do not have the ability to understand any of the calculations that you have made on those charts.

I, personally, do not want you to go into any further detail for my sake because I have got to the age where I am no longer willing to sit down and figure it all out. I'll leave that to the young guys and there are plenty on here who should be asking all sorts of questions.

But I pass. Everyone has his system and, although, I can pick up tips and ideas from others, the basic way one trades is his own.

So, I'll just read your posts and see where I can glean some useful information (I said that you helped me, once) and let the rest wash over my head.

Regards

Split
 
With a slight edit I think this sums up about 95% of people who start trading, young and 'old' alike.

No, there was a time when I was willing to sort out all kinds of ideas. Now, I find that it becomes more difficult to change one's own established ideas. Teaching an old dog new tricks argument.

mp has shown interest in showing his trading policy to us. I know that there will any number of younger folk (and older ones, too) out there who will have questions for him.

From time to time, I shall have some, myself, but I'm taking it easy! :D

Good trading

Split
 
mp6140,

Are these charts from Quotetracker ? the last sreenshot is the same as I have seen on QT


Paul
 
No, there was a time when I was willing to sort out all kinds of ideas. Now, I find that it becomes more difficult to change one's own established ideas. Teaching an old dog new tricks argument.

mp has shown interest in showing his trading policy to us. I know that there will any number of younger folk (and older ones, too) out there who will have questions for him.

From time to time, I shall have some, myself, but I'm taking it easy! :D

Good trading

Split
=-============================================================

hey split

sorry for the ton of information but the reality of trading what i do usually comes down to one short term chart ---- to illustrate the LRC and the zigs though, its necessary to show how i arrive there in the first place.

even if you only add the LRC to your arsenal, youre way ahead of not using them, because they provide such DEFINITE and VISUAL indications of support and resistance.

to see that in better detail, look at chart one and chart two, which are the same timeframe charts, but WHICH ONE TELLS YOU IMMEDIATELY WHERE THINGS ARE GOING ?

combine the channels with the zigzags (which are really nothing more than counting "waves" if you like that analogy, and the charts are simple.

i could easily have thrown a 5 minute up there and said --- see, this is how i trade, but the original concept would not have been shown.

Now "OLD DOG", I might be wrong, but want to compare ages ??

LOL

mp
 
Life is dangerous, enough, without making it more so. :)
It's all a state of mind Split. Danger. Life. Trading. Everything.

You tend to get what you expect to get. So, if you have the choice...

As for danger, risk and security, Helen Keller gets my vote:-

"Security is mostly a superstition.
It does not exist in nature, nor do the children of men as a whole experience it.
Avoiding danger is no safer in the long run than outright exposure.
Life is either a daring adventure or nothing."


Unfortunately, she's no longer around to ask and I don't think she ever traded, but I wonder how she'd stand on stops?
 
mp6140,

Are these charts from Quotetracker ? the last sreenshot is the same as I have seen on QT
Paul
===================================================

the first two are from MT4 and the last 3 from QT.

I could accomplish the same thing on MT4 but Ive used QT for centuries while doing equities, and it was a natural to simply continue using it. I started by using my original "equities trading system" and then slowly changing it to accomodate forex, and now i find that its even better for equities than my original.

mp
 

========================================

G-D BLESS !

ok, Ill send a nurse over with the "old guy" instuctions !

im a touch younger, but not a whole lot ---- but ive been ancient since around 20 !

mp
 
It's all a state of mind Split. Danger. Life. Trading. Everything.

You tend to get what you expect to get. So, if you have the choice...

As for danger, risk and security, Helen Keller gets my vote:-

"Security is mostly a superstition.
It does not exist in nature, nor do the children of men as a whole experience it.
Avoiding danger is no safer in the long run than outright exposure.
Life is either a daring adventure or nothing."


Unfortunately, she's no longer around to ask and I don't think she ever traded, but I wonder how she'd stand on stops?

My state of mind's OK. When I look at some of the retirees around here, living on SS and a warm park bench. :D I am very grateful for the way some of you guys keep my mind active and I. still, hold down a job, so that my kids don't have to work so hard.

BUT

Looking at mp's post with all those lines on all those charts I figure that I'd have to change a lot of ideas---not all bad--- that I have built up over the years. You may not believe this, but even a black background on a chart puts me off. So mp had better think twice before he tries to teach me anything ! :LOL::LOL:

As I said before. There are stacks of readers here who should take notice of him. I'll just read and I'm sure that I shall extract some useful bits for myself

Split
 
========================================

G-D BLESS !

ok, Ill send a nurse over with the "old guy" instuctions !

im a touch younger, but not a whole lot ---- but ive been ancient since around 20 !

mp

A nurse? Can she run fast?
 
My state of mind's OK. When I look at some of the retirees around here, living on SS and a warm park bench. :D I am very grateful for the way some of you guys keep my mind active and I. still, hold down a job, so that my kids don't have to work so hard.

BUT

Looking at mp's post with all those lines on all those charts I figure that I'd have to change a lot of ideas---not all bad--- that I have built up over the years. You may not believe this, but even a black background on a chart puts me off. So mp had better think twice before he tries to teach me anything ! :LOL::LOL:

As I said before. There are stacks of readers here who should take notice of him. I'll just read and I'm sure that I shall extract some useful bits for myself

Split

understand that i am indeed "right brained", having gone thru batteries of tests and crap to settle the question and therefore i "SEE" things differently than a left brained (normal human) does. My life has been as a "visual" person, so my charts are designed that way also and being an "analog" instead of "digital" person, this is how they come out ---- in the digital world, one would use colored bulbs to indicate trend and x-overs, but i guess im too old for that myself !

while i have removed "tons" of lines and such, all thats really there are the bollinger bands (well respected by forex as a "final" tp point), and the support and resistance areas --- while it looks complex perhaps, its actually very simple if you focus on the price and not the lines. I just know, when people grab onto what i have here, they "SEE" the market in a much plainer and simpler manner --- the ups and downs make sense and when we speak of "retracement", it is immediately and VISUALLY apparent, and not some random wanderings of a candle.

what i have put forth is simply a way of "SEEING THE MARKET" from a different perspective --- trading is trading, although i feel STRONGLY (and have been backed up by newbs) that this "visual" style simply shows what the market is doing in a very quick and sensible manner that differs (as u can see between charts one and two which are the SAME TF's and currency)from "normal" chart reading.
support and resistance and trend are the things i look for (trend of course if one is NOT using a sl is beyond "important" !

ALL I WISH TO POINT OUT AT THIS STAGE is how the price moves between the two limits of the channel, given that it can do only ONE of TWO things --- it will either break thru the channel to the up or downside, or it will continue to BOUNCE, and bounce is what it does so well !

The only rule, if there are any, is to GO FLAT when the currency hits the top or bottom channel and WAIT to see where it heads ---- ignoring that one rule can ruin more than just a good day !

Obviously, if you enter a short when the price hits the top channel, AND IT BREAKS OUT, you "do" have a chance of a 50% retracement during the day that "might" save you if you average up, but I wouldnt like to depend on it fully.

so what ive simply shown is top and bottom HISTORICAL limits which we trade TO but then wait to see what the bankers have in mind --- inevitably, if we second guess the banks, the currency goes the other way for real, and not just a minor retrace !

the chart attached shows an H1 of GU, obviously in a downtrend ---- the red and blue dots are support and resistance and the green lines are the LRC (linear regression channel) the purple lines and the thinner white lines are the zigzags, purple being at normal values and the white at HALF values, which allows me to monitor the baby reverses from the big strong adult reverses ! the arrows are simplified in this particular chart, so one gets a clearer pix of price action.

ignore the first indicator pak, but look at the second -- the blue line is the 50 ma and we see all the other ma's have dropped BELOW that line, definitely signalling a short which, while the action was happening (and not hindsite like now) we could tell trend by where everything was in relation to the 20 and 50 ma (BELOW the 50 and we got a short and above the 50 we got a long and the macd tells us when to expect a reversal) as its simply a "quick look confirming situation" (although one could trade the ma x-overs if they wished) Notice the two white arrows on the lower indicator --- the purple line is the macd at very abnormal values, and its diverged from price action along with the ma's all "clustered" which is the normal signal for an upside move coming, especially as the price has hit the bottom LRC line --- for a snap answer, i would say we would be going up at this point and NOT breaking down !

You might also notice an unusual pattern in this chart --- the thick aqua line, running across the chart from bottom to top is the 200 ma --- notice how "every other" zigzag situation seeks it for support or resistance -- i wouldnt put a lot of money on this situation, but its certainly interesting !

mp
 

Attachments

  • GU MACD EXAMPLE.jpg
    GU MACD EXAMPLE.jpg
    164 KB · Views: 185
Last edited:
Mp

So lets see if this daft bears got it right or at least got a rough idea how your going about getting all that nice Honey :) forgive me if I am way out, its just Bears do not use much to get their daily food

see an open car window and ......Bingo .........Free lunch :)

Simple Bear talk, excuse me if I am wrong and off down the wrong street mp :)

bears, by nature of their jovial personalities and unabashed cuddliness, should have NO problems obtaining food and treats from humans or otherwise !

identify a trend channel in the long term trend with or without coloured lines :) Joke

Day and 240 min chart and centre line the channel

Price leaves the edge of channel and trend is assumed to be intact and price WILL get to the other side when the major players allow it to, which because they love money will be at news announcements so they can take full advantage:?:

CORRECTAMUNDO !

If price as not quite reached channel edge or the middle of long term trend channel, price will keep going while the major players sell strengh or vice versa until price hits R or S and reverses and starts its long journey back again.

SMART BEAR !

You are so confident in your method you choose not to employ a stop but if others were going to use one, a good place for it might be some place outside the judged Long term channel I guess = Day or 240 min :?:

would depend totally on timeframe of course !

An Ideal trade which could have a very tight stop in relation to the time frame traded and use your ideas would be ............

1. mark your long term channels off Day & 240 min

MT4 can do that or you can do manually --- I havent gotten yet to the point of where TWO LRC's meet, telling you of the new trend direction !

2. check position of price in channel

3. check for news times over the coming week and watch price making its way to long term channel edge in the Day & 240 min candle chart

4. Enter a contra trade at channel edge at or just after News when price indicates it as run into R or S, you could use a lower tf to increase accuracy perhaps :?:

lower tf ALWAYS way to go because a 240 wont show you a good entry point for that candle and your trade is entered DEPENDENT on what price has been doing last few days and ESPECIALLY an hour or so before the news --- if the price is RISING before news, it will no doubt rise to the H1 or H4 resist point on the LRC and then DROP for next few days and vice versa if the news was DROPPING prior to news.

this is not perfect if there is a slate of news coming out, as witnessed by GU activity past week, although in hindsight its easy to see what happened, during trading the longer term macd divergence is what usually saves your butt. But this is also a very RARE situation, and as long as your trades are with the major trends, you can wait out an "accident".


At this point if the trade moves against you mp I guess you to take a loser the same as us less able traders :?: or do you go out to the weeks, then the months and then the 1/4"s and look if a really large channel is working over a number of years perhaps :?:

BEFORE i take the first trade of the day, ive already done that and so armed will rarely (but certainly not always --- even the gods make mistakes on alternate months !) take a trade that may put me in danger. (LOL)

what usually saves the bacon though is the major trends (daily, weekly, monthly) are moving in different directions and so i only need to find one to play off of, even if there is a wait involved ---- additionally, i might simply be able to average up or down to take advantage of the normal 50% retracement of the price, but as this is a "defensive" trade, i have to keep abreast of it !


5. Once trades off and running and in the money you nail down to the lower tf and mark off usual R & S points etc and trade contra and try to profit on the hedge trades also :?:

completely dependent on time of day, as there are two major price (although not necessarily trend) reversals in a 24 hour day with "minor" ones approximately every hour and a half --- go ahead and count them !

depending on the currency and how the brokers are handling the contra trades, I will take a "major" reversal (its usually the next to last trade just before a major reversal when the price goes up (lets say), hits resistance on the 15 min chart, then falls to the 50% fib and moves up for its final run before the "time of day" reversal --- mostly its just watching the clock.

another thing, IF THE CURRENCY DOES NOT REVERSE AT THE NORMAL TIME, it invariably will reverse 1.5 hours later, as the banks are letting the momentum carry the trade (which is usually DAY ONE of a strong reversal move on the 10 day chart)


I only trade the weedhopper movers mp on the Ftse but I can tell you that I have no problem at all with your ideas regards price being moved around the key levels, none at all.

The problem with such ideas is if you the trader......

Think its a FACT, it may well be a fact or everything could just be random, it does not matter at all, its just like rsi or instrument divergence.

well, it tends to be fact because, like using indicators that everyone else is using, it becomes a self fullfilling prophesy. of course, just because it "tends" to be fact doesnt mean it is written in stone, BUT if one is with the trend, the trade WILL come home to roost, maybe not this hour, or even day ---- but home to roost it shall come !

What is important for anybody imho following any method is knowing when the methods bombed out so you can get out in good shape to look for the next trade with no real damage done mp

If you think something is a Fact it will kill you dead as a Bear in hunting season :)

first understand bear that this is NOT a "method" per se, as im watching and taking the pulse of the market constantly from my little hovel we refer to as "corporate headquarters" --- I trade up, down and sideways dependent on where i belive the market will go and so am "adjusting" constantly.

BUT having said that, if you observe the market, the time of day of minor and major reversals, watch the LRC (trend lines and the demark work also), salute the bollinger bands at the end of a run (they are unfailingly accurate) and have some simple s+r overlays (theyre readily available as a custom indicator for the MT4 platform), youre gonna find you do really nicely.

for instance, here in the US the best trades are from 7 am EDT to noon, EDT --- after that, you brits go away to swim in your pints, and the brokers now REVERSE the prices, going short to make back the money that the retail traders made when the currency was long ---- at 5PM, EDT (rollover) things reverse again and from then until 10:30 pm, edt (asian market) its the brokers world, and all the "methods" in the world cant keep you perfectly safe as its now their ballfield, and they call the shots. Enter a trade and watch them stop short of your tp point, reverse and that point will never be hit until late at nite, when you guys get back online ---- its happened so much to me that even the normal sensible idea that NO broker really cares about my couple of lots appears not to be true --- i will intentionally open a long, find the price now reverse, open a short and watch the price come to a dead halt and then see the price trading between my two points until they are FORCED into moving one way or another --- i HAVE to enter a tp point because my broker (a russian spread better) has me on a 2 or 3 second delay and can catch almost any manual exit i try, unless i exit a few pips before the real exit point, at which point they will either be holding for the continuation of their trade, or try hard to lower my profit thru "slippage", which i watch while chuckling. Needless to say, when trading an ECN, i have no problems there !


understand though, these charts are put forth as a simple method of seeing what i speak of, and while a perfectly viable method of longer term trading, I havent brought forth the lower timeframes, which are the ones i really trade --- to see how one thing on one chart confirms or denies another chart is really the method I use --- since no sl's are being used, KNOWING whats happening and whats about to happen is of UTMOST importance, and that is where anything called a "system" shines through !

Please note that stoplosses come from the INVESTING side of the world, essentially for equities, and was used to REDUCE losses in a world where a decline in price could be for years, BUT THEY ARE NOT SUITED TO THE INDEX OR FOREX WORLD, which moves fairly rapidly in an up and downwards cycle and have approached an almost predictable status !

While my ideas (and those of MANY others) runs counter to accepted thought, after many years of trading one can see where the accepted thought may just not be very good !

as stated, if one uses the longer timeframes to establish trend, and trades the shorter timeframes WITHIN that trend, you will be way ahead of the game --- I certainly can name a number of newer traders on this site who have tried it and will trade no other way.

ONCE AGAIN --- demo it out and watch --- YOU WILL BE AMAZED BY WHAT YOU SEE !


While ALL of this might look complex, its really no more than an illustrated common sense approach to the markets movements and one can pick and choose what to add to their own personal "style" of trading --- ive been told that it contains ALL the needed ingredients for a successful trade, and my own experience bears this out --- its just trading, broken down to its individual parts and illustrated in the simplest manner i can come up with --- nothing really new there, just that i put it all together instead of breaking off pieces and making a system out of the individual pieces --- guess its just a "macro" version and most others engage in a "micro version !

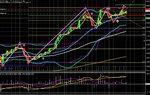
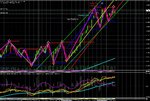
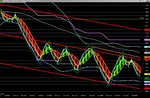
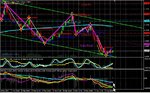
The ZIGZAGS show you, in a straight line, when a trend starts and finishes, the SUPPORT AND RESISTANCE shows you . . . . . . . . . support and resistance, of course. the LRC shows you what is NORMAL top and bottom for the currency and timeframe youre working in, the ARROWS show you present tp points and future tp points (after the currency retraces from its present high, it will go to the next arrows value on the chart --- this is MARKEDLY seen on the 5 minute, where you can actually trade up to the first arrow, exit -- trade the retrace short, then re-enter for the next 10 pip runup to the NEXT ARROW, and do that repeatedly --- ALL IN A PERIOD OF 5 MINUTES OR SO and probably grabbing 15 PIPS for your troubles ! Your warning is if youre playing the 5 minute and the new arrow does NOT APPEAR ON THE 15 min chart, then you do not enter long again. And finally, the macd/ma xover can be traded by itself, or used very accurately for early warning of trend changes.

Essentially, its nothing more than how traders trade --- going from support to resistance, wherever it may be while following trend.

Bears off for Sunday dinner :)
Latter

enjoy

mp
 
Last edited:
MP
How do you add MAs to the MACD like that in your pack?
I added the LRCs some time ago (under a different name (SHI Channels I think?) and noticed how accurate they were at calling the intraday movements combined with the key S/R levels. I think that Cable may have been a case in point today. The overall trend is down (daily) and there was a big 150 point plus rally today. So it got me thinking about what u said the other day. Was this action by the banks selling CFDs into that rally so they could short the shares and buy them back later at a reduced price? So I set my orders at where I thought the next key S/R level would be shold the price turn; and guess what, it did. So I made quite a few pips taking the opposite action to what the initial price action of the day was. Was this a fluke on my part? I'm not too sure, but it tallys with what you said about the price being pushed into a position for (maybe) the banks to capitalise on later on?
Grim
 
Thanks for answer to deleted post, how clever mp

mp

Thanks for answering the post I deleted because you had addressed my concerns while I was typoing in a previous post

all the best from the bear :clover:
 
Mp -- Momma, Make This Boy Some Potatoe Latkes !

MP

May i kiss you ? SOMEONE who ACTUALLY wishes to try something and NOT just dismiss out of hand --- you are a joy in my life, on my christmas list and in exactly 320 years from this minute, you have a private audience with the Pope !

and yes, the SHI channels do the same thing


How do you add MAs to the MACD like that in your pack?

MACD --- FAST (1), slow (5), MACD SMA (10) COLORS ARE -- MAIN (silver), SIGNAL (Magenta)
MOVING AVERAGES -- (2) exponential, yellow, applied to close, (5) simple, red, close
(12) exponential, Peru, close / (20) simple, lime, close / (50) exponential, Aqua, close.
Horizontal line --- (100) white

to set these up, you first build the MACD, then when you ADD another MA, you set it originally to "previous indicators data" in the "apply to" window --- once it has "stuck" to the previous indicator, you can then change it to its final "apply to", which in all cases is "close". Once the complete indicator is built, add the (100) horizontal white line.

you may use any colors you wish, but if you use mine, youll immediately know what the indicator is saying on any chart i display, and will be able to say such really techie stuff like "the green one is above the yellow one and the red one is going thru them both and looks to be going down !"

see, thats how we guru's talk to each other ! (LOL)


I added the LRCs some time ago (under a different name (SHI Channels I think?) and noticed how accurate they were at calling the intraday movements combined with the key S/R levels. I think that Cable may have been a case in point today. The overall trend is down (daily) and there was a big 150 point plus rally today. So it got me thinking about what u said the other day. Was this action by the banks selling CFDs into that rally so they could short the shares and buy them back later at a reduced price? So I set my orders at where I thought the next key S/R level would be shold the price turn; and guess what, it did. So I made quite a few pips taking the opposite action to what the initial price action of the day was. Was this a fluke on my part? I'm not too sure, but it tallys with what you said about the price being pushed into a position for (maybe) the banks to capitalise on later on?

THAT IS HOW THE GAME IS PLAYED !!!! (for the 300 and 20th time this month !) Banks have no "maybe" about pushing the prices to where they want them --- the name of this game is PROFIT, and whatever it takes is whatever they will do, and now YOU KNOW WHAT THEY DO !!!!!

As far as the channels are concerned, that is fairly normal activity for the first day of any move, BUT i SINCERELY advise you start using the s+r indicators for the remaining days as there is a tendency NOT to repeat the same action once the momentum dies down !


THANK YOU, THANK YOU, THANK YOU ----- one lone voice in the wilderness AND SOMEONE HEARD, and even made money ------ hurrah !
Grim

enjoy and trade well

mp
 

Attachments

  • @@@@ LRC &&&&&&.gif
    @@@@ LRC &&&&&&.gif
    15.6 KB · Views: 200
Last edited:
Mp -- Notice How Gu Is Dropping ?

ONE LOOK AT THE LRC WILL TELL YOU WHERE IT WILL BE TODAY !

now i know youse guys know EVERYTHING but i told you how to read this weeks ago

fortunately, there are some now making tons because they LISTENED !

DONT DO IT LIGHTNING -- im leading the horses to water, and sooner or later even the cautios bear will take a few sips --- we just have to get through this little dance FIRST !

never have so many worked so hard to NOT listen to someone !

sooner or later

mp
 
Thanks MP,
Still have a heap to learn and I'm only using small amounts at the moment but I have stabalized my account this year and have managed to stem the losses. At the moment I seem to be remaining even; some I lose but then others win it back. Needs a little more fine tuning!

I tend to try and drag the MA into the MACD indicator window but it still comes up on the price chart and not the indicator? There is no previous indicators data to tick or do I have to go into meta-editor?
Is that the indicator you were talking about for S/R?
I still need to read up on MACD a little as I was under the impression it was one of the slowest indicators with the biggest lag; but then I guess you just use it as confirmation NOT a rule for entry/exit?
Thanks again Professor Pips! (MP)
Grim
 
Top