You are using an out of date browser. It may not display this or other websites correctly.
You should upgrade or use an alternative browser.
You should upgrade or use an alternative browser.
Trading ES (emini S&P) - October 2003
- Thread starter stoploss please
- Start date
- Watchers 5
- Messages
- 2,325
- Likes
- 17
Ahhh ... so you were listening to me rabbiting on Saturday. 😀
Yes, it was - all the little boys bought the breakout, and went long expecting a nice run up. But the big boys, having run her up, stop her on a sixpence, then ram her down nice and hard, and to below the previous support thereby stop gunning at the same time as trapping all those longs at the top.
A nice little play at the end of a narrow range day, so seat belts fastened ready for some fun tomorrow.
sandpiper
Well-known member
- Messages
- 458
- Likes
- 54
Stoploss,
Whippy indeed. Once the initial head fake/trap was out of the way not much to work with. Key unfortunately (imho) was to look at the YM/ES/NQ together. YM not able to break below Friday high. NQ not able to break above Friday high. ES somewhere in the middle, not committed either way. Big move was not going to happen until NQ broke up or DJ broke down.
Not much of interest from a chart perspective.
Zone between R1 (YD Close) and R1 (TD Open) only of interest because there was also potential resistance at 1034.2-1036.5 on the large contract.
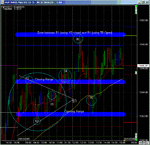
01) Broadening congestion with sagging bottoms with a doji that was as good a place for a short entry as anywhere.
02) Nice tight flat congestion that certainly surprised me when it broke up. Got on wrong side of that one.
03) Return to area of congestion is usually good for a short, if you get an entry bar.
Whippy indeed. Once the initial head fake/trap was out of the way not much to work with. Key unfortunately (imho) was to look at the YM/ES/NQ together. YM not able to break below Friday high. NQ not able to break above Friday high. ES somewhere in the middle, not committed either way. Big move was not going to happen until NQ broke up or DJ broke down.
Not much of interest from a chart perspective.
Zone between R1 (YD Close) and R1 (TD Open) only of interest because there was also potential resistance at 1034.2-1036.5 on the large contract.
01) Broadening congestion with sagging bottoms with a doji that was as good a place for a short entry as anywhere.
02) Nice tight flat congestion that certainly surprised me when it broke up. Got on wrong side of that one.
03) Return to area of congestion is usually good for a short, if you get an entry bar.
Attachments
Bigbusiness
Experienced member
- Messages
- 1,408
- Likes
- 23
My IB account is now open and I should be able to start trading tomorrow. But I think it will take a few days to read through the user guide. Is there a basic guide anywhere? The user guide is a bit too big to print out.
Any tips would be greatly appreciated. I have found a symbol for the ES but I am not sure it is the correct one.
Any tips would be greatly appreciated. I have found a symbol for the ES but I am not sure it is the correct one.
rossored
Senior member
- Messages
- 2,103
- Likes
- 56
BB the symbol should be ES-200312-GLOBEX
I dont think there is a basic guide anywhere other than what IB give you. The online tutorial is a bit more basic, I suppose.
I would, however, highly recommend a TWS front-end such as Tsim or Bracketrader, or autotrader, from which to run your trades.
I dont think there is a basic guide anywhere other than what IB give you. The online tutorial is a bit more basic, I suppose.
I would, however, highly recommend a TWS front-end such as Tsim or Bracketrader, or autotrader, from which to run your trades.
sandpiper
Well-known member
- Messages
- 458
- Likes
- 54
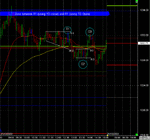
4 hours of nothing as expected, the by now well publicized 1-2-3 fake-out post fed move and then away she goes.
01) A move down to test yesterday PM's swing high. Followed by a move up to test YD High (and R1 Zone).
02) The second of 3 tests of opening range and the only congestion that was far enough away from YD High to present an opportunity to get long for a re-test of YD High.
03) Congestion followed by 1) re-test of high and R1 Zone, 2) Retest of opening range and previous congestion 3) Away, moves in direction of swing 1). It's interesting to see that the more this post fed move gets publicized, the smaller the swings are. May eventually stop working I suppose, but until then.
Attachments
sandpiper
Well-known member
- Messages
- 458
- Likes
- 54
sandpiper
Well-known member
- Messages
- 458
- Likes
- 54
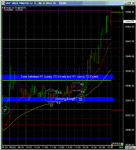
Interesting day I thought, something for everybody, though not particularly easy to trade.
01) Test of YD closing range.
02) Test of TD opening range.
03) Nice congestion to get long off for a test of YD high. Not needed since subsequent down bars provided a slightly better long entry. At this point I was transfixed by the wedge setting up across ES/YM/NQ. The breakout of the wedge on all 3 gave impetus to the long taken for the test of YD high.
04) A test of YD high with congestion. Too close to high to use for another long entry.
05) Test of R1 Zone and trap. Although the 14:00 bar was nasty, trading the 5 mim chart there was no reason for being long before it. Quite the opposite in fact.
06) On YM and NQ this was a perfect test of the apex of the congestion wedge formed earlier. On ES it "over ran" slightly but conveniently formed the doji. Previous congestions (particularly wedges) are usually good areas of S/R on which to base entries. The opening range just added weight to it's importance. Again the 14:20 bar was nasty but should have been "expected".
Attachments
- Messages
- 2,325
- Likes
- 17
You've chopped off the time on your chart, so I presume it is this morning's action out of the start.
I also can't refer to the time of the bars, so you'll just have to get the gist.
The doji was not standing proud of the bars on either side - the easiest way to trade dojis is
actually on a bigger timeframe as you need to be quite careful with dojis on 5 min charts.
The best way to trade them on a 5 min is to wait for confirmation of the direction, so in the
case above you would wait for it to break the high or low of the doji bar. So if you were
short you would still be short through that doji.
You can place your stops wherever you want to - if you want a tight trade then place them
at the tops of the highs, so you are dropping them down as the highs drop down. Or you
leave them at the top of the longer bars, as long as you've got the b*lls to hold through
a pullback.
Prices rarely drop and drop and drop without a pullback, so at some stage you would expect
a pullback to happen. It's at that point that you need to decide whether you're holding or jumping.
There was also a way of telling that was a pullback by being able to read the volume, but the
volume on your chart doesn't reflect the volume I have on my 5 min chart for the same period!
If you could number your questions it would be a lot easier to answer them! On the two proud
bars in the middle of your chart, the close on the second bar is way below the first bar, and that
is a very bearish sign, particularly as the bar opened at the top and closed at the bottom.
There are no hard and fast rules - you just need to learn to 'read' all the signs as they happen.
The longer the bar the easier it is - for little bars just concern yourself with the tops and
bottoms not the opens and closes.
hillbillie
Junior member
- Messages
- 29
- Likes
- 0
Interesting view from us site:
ES Z3 LONG TARGETS 1052 1056 1060 1064
ES Z3 SHORT TARGETS 1043 1039 1035 1031
NQ Z3 LONG TARGETS 1424 1428 1432 1436
NQ Z3 SHORT TARGETS 1415 1409 1403 1397
CENTER OF GRAVITY
ES Z3 1041.00
NQ Z3 1422.00
Overnight Range: Slightly negative as we head in to another buffet of econ data at 8:30, 9:45, and
10:00 AM. Don’t be surprised if we see a rush for the high of day in the first 30 minutes, as we haven’t
seen a negative reaction to econ reports in almost 4 or 5 months.
Friday is more often then not the reposition day. Today is going to be an odd one, and that is because
we generally look to follow through on Thursday weakness and buy Friday’s afternoon lows. However
yesterday cannot be called weakness. Although we tested those lose late in the day as we had
forecast, from 4 - 4:15 PM when snapped back sharp and closed closer to the high then the lows.
Today’s strategy: Econ data is sure to whiplash us around, and as indicated above I believe our
normal 3 day cycle is a bit out of orb this morning. We are going to have to let things settle after 10
AM and see if the cycle starts to balance in to our normal pattern. The DOW 9800 distribution levels
are still acting as a wall of Kryptonite.
All of the above being considered, our general read for Friday’s would be some selling in to 10:00 with
some sharp spikes up, slower selling after that in to 11:30 EST. A slow grind from there upwards for
about half of the mornings trading range to peak around 1:30 EST. A sharp dive then in to 2:15 - 2:30.
At this point we look for the reposition players to come in and feed the bottom, generally driving us
higher in to the late Friday close. Consider this general strategy in the context of this econ number
environment, and lets adjust during the day as conditions warrant. Today’s buy and sell numbers are
below:
Below are your main Buy/Sell Numbers and important time pivots for today’s session:
ATR ES Z3: 11.00 POINTS MAIN ES Sell Number: 1055.75 MAIN ES Buy Number: 1043.00
ATR: NQ Z3: 26.00 POINTS MAIN NQ Sell Number: 1448.50 MAIN NQ Buy Number: 1412.50
Time pivots today: @ 8:42, 8:54, 10:31, 10:57, 11:38, 12:01, 12:58, 1:13, 2:09, 2:51, 3:12, and
3:29 EST.
NOTES:
•
When Main Buy/Sell numbers get violated they become auto reversal triggers. A violated buy
number becomes an accelerated selling trigger and a violated sell number becomes an
accelerated buying trigger.
• Add ATR to first hour’s low to project intraday highs – Subtract ATR from first hour’s high to
project intraday lows.
• I use proprietary time pivots to look for the points today when I expect the trend to either
accelerate or reverse. These are for a “heads up”.
Bigbusiness
Experienced member
- Messages
- 1,408
- Likes
- 23
I have been looking at the ES and YM for the past few days. I am used to spread betting the Dow, so I find the YM easier to read. Tsim is a nice front end to trade with IB and the simulator is good for practice. Made my first profitable trade but I am going to take my time and will only trade properly when I am comfortable with all the new software.
Thanks for all your help. If this thread hadn't started I might not have taken the plunge.
Thanks for all your help. If this thread hadn't started I might not have taken the plunge.
BB
I don`t know if you do already but I find it very good to have an ES, YM and NQ chart open at the same time.
You get a very good feel for what the market`s doing and where it`s going and a different one leads most days.
I realise I might be teachin you to suck eggs here. 😀
Steve
I don`t know if you do already but I find it very good to have an ES, YM and NQ chart open at the same time.
You get a very good feel for what the market`s doing and where it`s going and a different one leads most days.
I realise I might be teachin you to suck eggs here. 😀
Steve
Bigbusiness
Experienced member
- Messages
- 1,408
- Likes
- 23
Good point Steve. I might have to get a second monitor as it is hard to see all these charts at the same time.
china white
Established member
- Messages
- 979
- Likes
- 12
beware of Volatilities
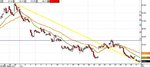
just a quick note - we had no upside over the last 3 days, however look at frond-end volatilities. I'm personally positioning myself for quite a bit of a sell-off in the beginning of next week. 1052 cash will have to be taken out swiftly on Monday morning to negate this picture - otherwise loads of chaps will view the current point as a perfect dubl top, IMO.
just a quick note - we had no upside over the last 3 days, however look at frond-end volatilities. I'm personally positioning myself for quite a bit of a sell-off in the beginning of next week. 1052 cash will have to be taken out swiftly on Monday morning to negate this picture - otherwise loads of chaps will view the current point as a perfect dubl top, IMO.
Attachments
Similar threads
- Replies
- 0
- Views
- 2K
- Replies
- 1
- Views
- 872
- Replies
- 16
- Views
- 11K