Trading ES (emini S&P) - October 2003

Know thy enemy!

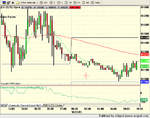
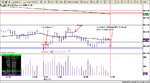
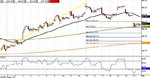
As ive mentioned before i do not use pivots but i do appreciate the importance of knowing what may happen as a result of the interaction of price around these levels.

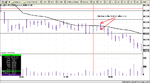
The price gives a nice reversal indication premarket just above the PP. The turn could just as well have been on or past the PP the point is once you have identified a potential s/r level (in this case a PP) then you are aware of the possibility of something happening at these levels and when price unfolds to tell you what it will be then you will be all the more prepared to take action
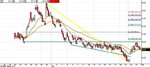
 

Attachments

  • snapshot-5.png
    snapshot-5.png
    86.2 KB · Views: 601
S&R 22/10

Todays S&R

Hi

Going by the 5 and15 minute charts, I have these levels. A lot of numbers due to the tight range of the past two days. Do these numbers look good. I am not to sure myself.

1047.75
1046.00
1044.50
1043.75
1040.00
1036.00
1034.25

Kind regards
Andy
 

Attachments

  • dow 5min62.png
    dow 5min62.png
    25.8 KB · Views: 588
Hi ya`ll

First, yesterday was a very good day for scalpin. I used to try and do it with spreads but it`s sooooo much easier with direct access.

The sideways consolidation in the afternoon was a joy to behold ( and trade)

Today pivot S/R not great, as is often the case with gaps, but there were some trades early on. ES failed to stay below S3 at around 10am and failed to penetrate S2 at around 10:20 am (all times EST)

Nq bounced off S2 also at around 10am.

But the trade of the day for me has to be when the NQ bounced twice off yesterdays low and we all dropped :D

Steve
 
I have finally filled out the IB forms so hope to join in on the fun soon. Those tests were a laugh. Are they GCSE standard :)
 
China White,
Thanks for your insight into TICK.
I see I've got lots to learn!
hampy
 
what I make out of it

ok, this was a mcclose - but a neg one :devilish: obviously my C&H call from lat night went pete tong.....

The sell-off was held at about 1028 - which is 38.2% Fib retracement (see graph), 200 ma sup and first horizontal sup - no wonder we had a bounce there. Fib level was pierced on ES but held, on Comp it was not even pierced.

Just looking at ES 60 min, I still think 50% retracement + 2nd horizontal sup @ 1020ish will be tested though. Actually, intraday dip towards 1020 and a strong reversal to the close on increased VIX wud be the best case for bulls IMO
 

Attachments

  • cme-es03z- 60 minute.jpg
    cme-es03z- 60 minute.jpg
    79.3 KB · Views: 533
how TICK helps even in wrong bias

I know many traders wud assume that TICK is not that useful on aBear Ugly day like this - and I completely understand the reasoning behind it - on such days all u need to do is to watch price action and short any attempt at 40 ema (5 min).

However, I thot it'd be useful to every1 to c how TICK-trading works on such a day - making dosh even when the author was WRONGLY BIASED almost all day long. The graph below is self-explanatory IMO - 3 PDs - 3 long trades and 1 ND - 1 short in the last hour. 8.5 pts in the pocket being in a wrong position 3 times out of 4 :D
 

Attachments

  • tick2210.jpg
    tick2210.jpg
    45.2 KB · Views: 505
Not difficult to figure out today was going to be a down day....
 

Attachments

  • es2210031min.gif
    es2210031min.gif
    35.6 KB · Views: 496
perfect chart as always, CM! of coz once 1042 was lost in the after-hours, retested from underneath and gone - it was just down, down, down.....
 
Consolidation

I have always had a problem trying to work out which
way a consolidation will break out to. Does the following
sound right.
 

Attachments

  • dow 5min66.png
    dow 5min66.png
    19.7 KB · Views: 547
All the tops of the highest bars since 16:00 on your chart are progressively lower; that indicates that the bulls are losing strength to the bears. It also gave you a very strong area of resistance. Entering a short along there would have been minimum risk, coupled with two or three areas of resistance.

The bar you show is a doji - a sign of bulls=bears, and often a turning point. That doji is sticking up above the bars on either side, showing you that the only way was down!

Often on sideways stuff it is easier to see on the 10 minute chart. :D
 
Stoploss,

Not much to add to Skimbleshanks comments, since they were bang on as usual. A quick note of what was going through my mind at the time:

01) Initial BOs from congestion are often traps. It's a much higher percentage play to wait for a second one.

02) As Skim says, the doji inside the congestion gives you an edge with your entry if you are anticipating a second attempt at the BO.

03) Another one of Skims dojis before a DB.

04) And I love these.... a return to the congestion area (high probability of some resistance here) and the retreat.

Several other useful patterns in there (for me at least). One of them being the tighter congestions within the larger one on yours and my chart.
 

Attachments

  • es 5m chart gif.gif
    es 5m chart gif.gif
    16.5 KB · Views: 543
Todays gap play

I do not trade the first half hour. Its a rule I have written and one I have decided not to make any exceptions to. Anyway. here is todays gap play. Would this be right.

Cheers
Andy
 

Attachments

  • dow 5min67.png
    dow 5min67.png
    24.4 KB · Views: 499
Question,

With the gap being filled on the first peak, would you have covered there or wait to see how the first trough develops.

Cheers
Andy
 
I would have covered there on the first peak - she also stopped at 1030 which is a psychological number. And then shorted, and then gone long until the double top (easier to see on the Dow today) and then down to the double bottom, etc.
 
Bulls vs. Bears

U may recall I was talking about dipping to 1021 - 50% Fib retracement on ES. As always :cheesy: the mrkt took a mickey at my faffing and bounced right off 50% retracement on Comp and SOX (which is also their 200 ma 60 min sup) with spooz hanging well above. I am attaching SOX graph as it was the biggest laggard today, hence its bounce is more meaningful.

As such, today was good for the BULLISH case.

As for the BEARS' case, it does not take too much imagination to see today's action as a major bear flag on all indices.
 

Attachments

  • sox2310.jpg
    sox2310.jpg
    58.3 KB · Views: 449
how yesterday Ugly Grizzly cud be predicted

I spent quite a bit of time thinking about that last dip in the final minutes of Tuesday's action - mentioned in "How do they know?" post and discussed in some other posts. I can clearly see now why my C&H call on Tuesday's night was doomed to go belly up.

Look at volatility readings. No upside on Tuesday whilst front-end SP500 (VXO), same as SP100 (VIX) goes bust, B/D from the triangle and staying there for the whole day. That last dip was the sharper eyes amongst us who figured that in such a set-up u either dump the futures at the close or buy VXO futures (or do both). Voila! :cheesy:

where from now? 20 VXO is a crucial level, funnily on untradable VIX u'll see an expanding tri, with higher highs tested on the upper boundary. My take is that we'll test 50% Fib retracement (21.4 VXO) very shortly, perhaps tomorrow.

Which means there'll be more downside pressure. However, we just have to c how price will react to a 7% increase in volatility reading (if that happens). If selling-off is limited, BUY ES futures or SELL VXO futures, imo.

Of coz we can easily lose 20 again and retest Tuesday. same logic applies (in reverse ;) )
 

Attachments

  • vxo2310.jpg
    vxo2310.jpg
    44.1 KB · Views: 469
Top