Trading ES (emini S&P) - October 2003

stoploss please

Established member
Messages
780
Likes
10
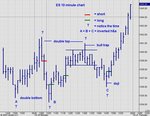
Trading the ES 20/10 to 24/10

S&R & pivot calculations for 20/10/03
Hi

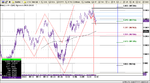
S&R are obtained from the previous two days price action. This is where I think they should be. It would be good to hear if anyone has different calculations. These levels have been taken from a 15 minute time frame.

S&R

1052.25
1047.25
1043.50/1042.75
1038.50
1034.75

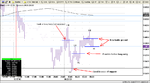
Pivot points, all obtained from a pivot point calculator.

http://www.stelaronline.com/resource/pivot.htm

R3 1065.50
R2 1058.75
R1 1048.25
Pivot 1041.50
S1 1031
S2 1024.25
S3 1013.75

Fib levels from low of 30/09 to high of 15/10

25% 1037.34
38.2% 1028.62
50% 1028.84
61.8% 1013.05

Other areas of interest,

Higher gap level at 1024.25. This equates to S2 obtained from the calculator.

Lower gap level at 1021


Kind regards and happy trading
Andy
 

Attachments

  • dow 5min50.png
    dow 5min50.png
    32 KB · Views: 1,132
Morning session

My first day trading the ES without indicators. A bit of a tough one for me thus far. Made a small loss on what I thought was a break up on decent volume only to see it reverse. I closed it on my stop which was a wise move in the end. We then had a good bounce off support and the next HL signaled a further advanced. Unfortunately, the next HH has stalled a bit. Watching the tight fulcrum for further direction.
 

Attachments

  • dow 5min53.png
    dow 5min53.png
    25.5 KB · Views: 1,118
Skim, if its not too much trouble do you think you could stick one of your charts on at the end of each day with the correct ES entries placed? Understand if not but your viewpoint on each day would be immensely useful.

Thanks

RR
 
This pattern has occured alot and it seems to break up in the afternoon. However, that double top at 1052 worries me if you know what I mean.
 
stoploss,

Just one thing, if I may be so bold?

I noted that Skim said she doesn't "use" the floor traders pivots but knows where they are (if I recall correctly). You worked out what the numbers were and then took a long right below the pivot. Not necessarily a bad thing, but (imho) a trade looking to be scratched at the first sign of a bounce (if you took it).

For me this would be especially true given that it occurred before all nyse stocks were open and just before 10:00 time.
 
Hi sandpiper

A bit of impatience on my part. From what I can gather, pivot points are not reliable and most traders use horizontal support. The arrow points to a bar that broke beneath where I placed support then closed above it. I went long on the break above that bar. I was in profit for a mere moment then it reversed which was very rude of it. This trade felt all wrong as soon as I hit the button.

Never mind
 
hope u don't mind me moving to ES board

lads/lasses,

I am glad there is an ES board now - i felt a bit awkward posting ES graphs on Chartman's Dow trading board..... :cheesy: Anyway, I wanted to share with u what I make out of where we r.

u may recall last week I was looking for the "ideal" case of a fake B/D from the U/T, prices falling to 1038ish level, bulls getting a bit scared, thus clearing the way for another leg up. I reckon this is exactly what's happening. The H&S (see graph) id duely completed, its bottom tested, and Spooz turned north. We'll just have to c if there is gonna b a strong day tomorrow. I haven't yet got the McClellan change for today, but I bet it's gonna b a positive minor change - which would hint at a 75% chance of positive mcclose tomorrow or on Wednesday.
 

Attachments

  • cme-es03z- 5 minute.jpg
    cme-es03z- 5 minute.jpg
    69.8 KB · Views: 1,093
day trading ES on 20-10

quite a lovely day IMO - with easy 16-18 pts in the bag. At 10:10 clear B/D of the lower T/L from Friday's lows - and then from 10:30 onwards clear hints from TICK (see graph). I personally try not to use TICK to much in the 1st hour as u haven't got the anchor pts yet.

The only tricky bit was late ND on TICK. Very tempting to reverse to short. Which wud b wrong IMO, since we had only ONE positive time frame (15:30ish) by the close, and Spooz rarely reverses in the last half an hour.
 

Attachments

  • tick.jpg
    tick.jpg
    42.8 KB · Views: 1,093
The following is the 10 min ES chart for today, annotated with things which I found interesting.

Note the times of the turns - all on the o'clock or half hour.

Mondays often have a slowish start, on lower volume than other days of the week. Out of the starting gate she went sideways, so if you enter when no definite trend is in place, then just grab 1.5 points or so when it's given. Then wait and get in again.

I've posted a similar chart before - today we just bounced between a double top and double bottom until we formed an inverted h&s. Once that bottom pattern was in place, she just went whoosh! All of the subsequent 10 min bars had a higher low.

The bull trap is easy to spot - price rises above previous resistance, all the little boys playing breakouts piled in with longs, and the big boys turned her and trapped them holding their longs. It's a standard game, and just another way for the big boys to get good prices for their shorts. If you've traded breakouts, you'll know what it's like to get spanked by big boys. :cheesy: That's why those of us on the dark side don't trade breakouts.
 

Attachments

  • es 10 min 20 oct.jpg
    es 10 min 20 oct.jpg
    63.5 KB · Views: 992
Skim - completely right - this is where I find TICK irreplacable. It is perhaps the only indicator that filters away those fake breaks imo.
 
Hi

I have some figures for S&R

1052.30
1047.36
1043.56/1042.74
1038.61
1034.31

Yet again this is where I see S&R on the 15min chart. Please post if you disagree.

I have dumped pivots as do not feel they offer anything.
 
china white,
(with apologies to stoploss for talking about indicators)
I have recently been reading up on trading with the TICK, but had not seen any mention if it's use in filtering fake-outs.
I'd be grateful if you could explain the patterns/values you look for to avoid getting caught by similar situations to that shown on Skim's chart yesterday
Thanks,
hampy
 
Hampy

This thread is open to all styles. Especially ones that make money
so feel free to discuss all methods.

Cheers
Andy
 
Stoploss,
Pivots are like everything else sometimes hey work sometimes they don`t, I find they help me to put som structure to a chart.

Today the ES tried 3 times to penetrate the pivot early on, failed and rallied 4 points.

Then the NQ tried twice to penetrate R1 failed, and everyone then dropped back down.

As with all things if you don`t like it, or it don`t " suit you sir" :D don`t use it.

Steve
 
Hi Steve

The way I see it, I have enough to think about with horizontal S&R. I find pivots are just adding another layer of confusion for me. No doubt pivots are used by other traders with success but I decided that one or the other had to go.

If you would like, why not post your daily pivots to this forum and then summarize how they performed at the end of the days trading. In this way, we can create a panoramic picture of how traders, approach the ES with different styles.

Kind regards
Andy
 
stevem12,

Hope you don't mind. Had 5 minutes so I thought I'd post this up and save you the trouble.

Key:

Red dotted line = Pivot calculated from YD Close
Green dotted line = Pivot calculated from TD Open
Green solid line = YD High
Brown Line = YD Close
Solid Blue Line = R1 calculated from YD Close
 

Attachments

  • es 5m chart gif.gif
    es 5m chart gif.gif
    25.1 KB · Views: 667
Stoploss,

For the white knuckle floor pivot trader there were clearly a number of long entries off the pivot itself and then a short off R1.

Even though I don't use the pivots for entry, I wouldn't short just above todays pivot or go long just below todays R1.

As stevem12 suggests, if nothing else it provides me with a "context" in which I can assess today's action. I also find that by having pivot points on the ES, YM and NQ I can judge the relative strength/weakness of each of them against the others.
 
sorry, jik anyone is checking the numbers..... solid bule line is R1 calculated from today's open (not YD close).
 
21-10

lads/lasses - sorry if I invaded a no-indicators territory! My only excuse is that TICK and TRIN r dabatably not indicators as such - they r just market tick-by-tick measures :D well, debatably as I said :cheesy:

hampy to answer yr Q - all the usual indicators like RSI, CCI, ADX etc. r calculated from PRICE snapshots and therefore vulnerable to giving fake signals when u get a fake B/O or B/D. TICK does not care about where the price is, it measures directly buying and selling intensity. E.g. from 20-10 take a butcher's at 13:00 fake B/O - TICK was clearly lagging showing fading buying interest - clearly chiselled ND.

U'll c another example in 21-10 action. One possible short in the 1st hour, basing on TICK MACD turning south (which the author pathetically missed :cry: ) then clear head-up right after 10:30 - long at 1042.25. Best exit wud present itself at the first peak - however the author thot that 1) neg time frame was ending shortly; 2) a pos time frame was established extenting into the close - possibly strong close; 3) SOX and Comp were clearly behaving like on a pos mcclose day - author stayed long expecting a second leg up after the neg time frame was over. Jibbering around for quite a bit, and scurrying for cover at B/O attempt when a new neg time frame was clearly established, also reaching into the last hour (Hampy, clearest TICK ND - u wudnt catch it from price indicators) @ 47. Highly speculative long entry shortly afterward @ 45.25 (don't call it TICK PD! - not confirmed by TICK MACD or MA, just 2 troughs), out @ 46.75 seeing TICK ND.
Altogether rather happy with 6.25 pts in the pocket.

As expected, messy last hour with 1 neg and 1 pos time frames overlapping.
 

Attachments

  • tick.jpg
    tick.jpg
    42.7 KB · Views: 663
Longs and shorts

Hi Sandpiper

Interesting way of using relative strength. This is all good stuff. We are compiling a good thread here with divergent ideas.

As I am trying to stick to Price and Volume together with horizontal resistance, pivot points do not fit into my plan however I agree they have their rightful place and can be exploited in a flexible trading style when other methods or not giving clear signals.

Here is todays chart. Not a wide range so therefore, you had to be nimble. Probably good for a scalpa with direct access but for a newbee like me spread betting today was not very profitable. Nice drop at the end but even that turned chop souey.

Would be good to here from any scalpas out there on how they traded today.
 

Attachments

  • dow 5min61.png
    dow 5min61.png
    24 KB · Views: 628
Top