Trade Market Direction with Options

RogerM

Established member
Messages
752
Likes
7
If you find that you are wearing out the carpet between your screen and the toilet because that short you've just placed is going up, why not use options to play moves in the indices.

Here is a scenario that I worked out with the help of a talented mentor on 2nd Jan with the S&P at 1116, since when it has gone to 1131 and pulled back a bit.

The aim is to profit on an orderly pullback whilst hedging against an immediate spike up.

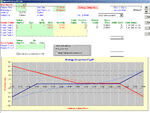
First put on a March 2 x1 short synthetic. i.e. Sell March 2 x 1150 calls for 15 and buy 1 x 1100 put for 27. (Red)

Then put on a January 2 x 2 long synthetic. i.e. sell January 2 x 1050 puts for 2.15 and buy 2 x 1150 calls for 2.05. (Blue)

The end result is shown on the payoff diagram below. The Jan options are shown in Blue and the March positions in Red. If the market spikes up above 1150 before the Jan expiry, you gain more or less $ for $ on the Jan long calls as you lose on the March short calls. If the market carries on rising after the Jan expiry then you have a loss situation if the S&P rises above the greater of 1150 or the Jan expiry AND IT KEEPS ON RISING.

Likewise, if the market tanks below 1050 before the Jan expiry (January short put strike), then you start to give back some of the profit accumulated in the March long puts, and probably show a loss below about 1010.

In the event of an orderly decline, which can go below 1050 after the Jan expiry (when the Blue strategy disappears), profit accumulates in the long March puts. And you still only have to worry if the market rises above 1150 before the March expiry, and there should be an opportunity to buy back the short March 1150 calls at less than you sold them for at some stage in the life of the strategy if they worry you because time-value decay is working in your favour.

So if you get the move, there is immediate profit. If it moves against you there is no problem below the higher of the Jan expiry or 1150, and no problem at any level between 1050 and 1150 before the Jan expiry. There is room to move, and sleep comes easily, and you avoid all the angst that you've been putting yourself through if you've stood in front of a rally and it's running you over. Just a thought!
 

Attachments

  • robint jan 2004 short synthetic.gif
    robint jan 2004 short synthetic.gif
    38.1 KB · Views: 1,236
Thank you for the interesting post.

I am slightly puzzled by the following sentence:

"First put on a March 2 x1 short synthetic. i.e. Sell March 2 x 1150 calls for 15 and buy 1 x 1100 put for 27."

Is there another name that the above goes by?
I wouldn't naturally call this a short synthetic .
Something like short ratio combo maybe!

I often get confused by the different options terminology used to describe the same position.

Are you using the above terminology as the position benefits from a downward move, mirroring shorting?

Kind regards

Marcus.
 
Nice thinking and a well thought out trade Roger

That Hoadley software is great isn't it?
 
Marcus - fair point about terminology, and that's why I show the actual constituents of the position to avoid ambiguity. Strictly speaking a short synthetic is a short call and a long put at the same strike price. In practice, I'd rarely use this as the advantages over just shorting the future are small.

If you split the strikes of the short calls and long puts, then it becomes a "split strike synthetic". This gives some space for it to move against you before you start to lose money at expiry.

Given that the aim of a split strike synthetic is to put it on for nothing (i.e. the short call pays for the long puts), you can sell 2 calls for each long put which enables you to write the calls further out to give you even more space before it starts to cost you if you get the direction wrong. This is a "2 x 1 split strike short synthetic". The downside is that if it gets to the strike of the short calls, it will go wrong at 2 x the rate of a simple 1 x 1 split strike short synthetic.
 
Here's an interesting FTSE 100 trade another contributor, who I will not embarrass by naming, put on back on 02 Dec 04. Thought of following him in, but didn't, to my eternal regret.

Started by opening the following on 2nd dec, with FTSE at 4760 :-

Buy 1 x June 4825 call @ 125
Sell 1 x June 5125 Call @ 29.5
Sell 1 x June 4225 put @ 39.5
Sell 1 x January 4875 Call @ 27


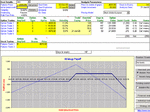
The first payoff diagram explains it better than any number of words. The strategy was opened for a debit of 29 (i.e. £290 with the FTSE at £10 per point). There would be a profit if the whole strategy was liquidated at the January expiry provided the FTSE was between 4675 and around 5010, as shown by the thin blue line, which shows the value of all positions as at 21st Jan. Provided the FTSE was below the January strike of 4875, then all the premium taken of 27 ( £270 per contract) would be retained.

The Jan expiry was somewhere around 4800, so the January 4875 call expired worthless, enabling the whole premium of £270 per contract to be retained. After 21st Jan, the short Jan 4875 call was no longer a liability. The next short call is the June 5125, which is covered by an equal number of long June 4825 calls - leaving a bull call spread, with short June Puts at 4225.

The current pay-off diagram with the FTSE at 5040 is very appealing. Current profit of about £1500 per contract, with an immediate downside of just £290, although losses are theoretically unlimited if the ftse falls below the strike of the short puts at 4225 - currently 800 points away. If this is a concern, it can be bought back for about 3.5 (i.e. £35) and in fact would be a good idea, given that it was sold for 39.5, and there is only 3.5 points of time value remaining. Why carry the risk just to squeeze out the last few points? This leaves a maximum possible loss of £325, and a max possible profit of £2440 if the ftse expires above 5125 in June.

Of course it can always be closed out for a profit at anytime before. Or some more calls could be sold above the current level, which would give the potential for a free remaining position if they expire worthless. This is a great example of how to set up and manage a directional trade - well done.
 

Attachments

  • bull spreads 140205A.gif
    bull spreads 140205A.gif
    70 KB · Views: 650
  • bull spreads 140205B.gif
    bull spreads 140205B.gif
    37.8 KB · Views: 533
Very interesting posts, I have always been fascinated by the clever strtegies that options players employ to set up these plays, am I right in assuming that the options discussed on the FTSE will be european style options, ie cannot be exercised until expiry.
Thanx
 
Yes - the FTSE 100 index options are always European. In fact I believe the American Style FTSE options have been discontinued thru' lack demand.
 
Roger,
Yes you are correct in what you say about the footsie is Eu style, and the american has been stopped.

I would like to make some observations on the FOUR leg trade you mentioned earlier. [trade date 2 dec 04].

1. The first 2 trades are covered.

2. The last 2 trades are naked.

3. The market has moved to 5040, thats a 280 pts rise on the footsie.[trade opened at 4760]

4. There must have been margin payments on position.

5. If the £290 [without margin] was used on a cheap straight Call position in the Feb's contracts the profits would have been greater still.

6. What if the mrkt went down by same amount [280 or more] the four leg'd position would be showing a loss?

bull
 
The position when dissected shows that it's a combination of two spreads:

(1) a long 4825/4875 Jan/Jun Diagonal @ 98 Debit
(2) a short 422/5125 Jun Strangle @ 69 Credit
Net = 29 Debit

An analysis of each componet trade will be useful.

The diagonal is +theta, -gamma, +vega and would have made max profit if the FTSE closed at the short strike of 4875 at Jan05 expiration. The position would still be in profit if the FTSE closed above 4875. The risk in the trade is IV collapse and a downturn in the FTSE below the breakeven. Looking at the IV for the respective strikes we seek that there is a slight -ve or reverse skew; therefore, we are buying expensive options and selling cheaper strikes. Typically, we'd want to do the reverse so that as the skew vanishes we realise a profit. However, because the IV's for the respective strikes are fairly close there is very little to worry about on that score.

The strangle is predominantly -vega. Theta and gamma are small because of the length of time left in the position. Unless IV falls appeciably this position will have to be carried close to expiration (any way to know historical levels of IV?). In that case the cost of carry (loss of 6 months interest on capital tied up to maintain margin) should be taken into account. If cost of carry exceed 69p this position is a looser.

Combining both positions results in a +theta, -gamma and small or neutral vega position. When the short position expires in Jan05 the resulting trade is a Bull Put Spread plus a short Put - a very bullish trade. The primary concern with this position as placed is that profit will not begining to be realised until May05 when theta decay begins to take effect. The FTSE could surge to 5000+ and the position would still struggle to turn a profit. Added to this is the prolonged exposure to downside, uncapped risk. Being naked an option is not a bad thing, but I'd recommend this is kept to the shortest possible time frame, say 30 - 45 days.

In conclusion I wonder if it would have been simplier, safer and more profitable to have kept the strategy simple by rolling the diagonal to Feb05 and not open the short strangle. I don't see what it's bringing to the party, but hey, I'm willing to learn.
 
bulldozer said:
Roger,
Yes you are correct in what you say about the footsie is Eu style, and the american has been stopped.

I would like to make some observations on the FOUR leg trade you mentioned earlier. [trade date 2 dec 04].

1. The first 2 trades are covered.

2. The last 2 trades are naked.

3. The market has moved to 5040, thats a 280 pts rise on the footsie.[trade opened at 4760]

4. There must have been margin payments on position.

Yes, the position would have required margin. Not a lot I would think, although I didn't run it through SPAN at the time.

5. If the £290 [without margin] was used on a cheap straight Call position in the Feb's contracts the profits would have been greater still.

With the benefit of hindsight, a cheap call would have performed as you say. How I would love, just once, to be able to set up a trade with the benefit of hindsight! At the time, the aim was to put on a long trade for minimal outlay, with low risk of loss other than following a complete market collapse or a mega short term rally.

6. What if the mrkt went down by same amount [280 or more] the four leg'd position would be showing a loss?

bull

280 points down would not have caused a problem. 4760 - 280 = 4480, and with the short put at 4225 there would still only be a £290 loss at expiry, although it would currently be underwater to the tune of about £900.

For me, the appeal was that unless there was an improbably large rally, there was very little risk from the short Jan 4875 calls as they would be covered by the long June 4825 call up to around 5010 - an unlikely event at that time. After the Jan Call expired, there would be no upside risk.

Likewise, losses would be limited in the event that the market fell by anything up to 535 points ( 4760 - 4225). The view was that the market was going to rise, but not necessarily in a straight line, but that a 500+ point decline was unlikely in the short term. After an appreciable rise, the premium would go out of the short puts, and they could be bought back cheaply. If the market fell appreciably, it may be necessary to buy back the short puts for a loss, but that could have been partially financed by rolling them down., although personally I'm uncomfortable rolling down puts. However, after a 500 point decline, IV would have been significantly higher, and the premium that could have been raised would have been significant (same goes for the cost of buying back the 4225's of course).
 
belinea03 said:
The position when dissected shows that it's a combination of two spreads:

(1) a long 4825/4875 Jan/Jun Diagonal @ 98 Debit
(2) a short 422/5125 Jun Strangle @ 69 Credit
Net = 29 Debit

An analysis of each componet trade will be useful.

The diagonal is +theta, -gamma, +vega and would have made max profit if the FTSE closed at the short strike of 4875 at Jan05 expiration. The position would still be in profit if the FTSE closed above 4875. The risk in the trade is IV collapse and a downturn in the FTSE below the breakeven. Looking at the IV for the respective strikes we seek that there is a slight -ve or reverse skew; therefore, we are buying expensive options and selling cheaper strikes. Typically, we'd want to do the reverse so that as the skew vanishes we realise a profit. However, because the IV's for the respective strikes are fairly close there is very little to worry about on that score.

The strangle is predominantly -vega. Theta and gamma are small because of the length of time left in the position. Unless IV falls appeciably this position will have to be carried close to expiration (any way to know historical levels of IV?). In that case the cost of carry (loss of 6 months interest on capital tied up to maintain margin) should be taken into account. If cost of carry exceed 69p this position is a looser.

Combining both positions results in a +theta, -gamma and small or neutral vega position. When the short position expires in Jan05 the resulting trade is a Bull Put Spread plus a short Put - a very bullish trade. The primary concern with this position as placed is that profit will not begining to be realised until May05 when theta decay begins to take effect. The FTSE could surge to 5000+ and the position would still struggle to turn a profit. Added to this is the prolonged exposure to downside, uncapped risk. Being naked an option is not a bad thing, but I'd recommend this is kept to the shortest possible time frame, say 30 - 45 days.

In conclusion I wonder if it would have been simplier, safer and more profitable to have kept the strategy simple by rolling the diagonal to Feb05 and not open the short strangle. I don't see what it's bringing to the party, but hey, I'm willing to learn.

belinea03 - thanks for a well thought out response.

I'm not presenting this as a perfect trade, and neither would the trader who shared it. This is a real position, not one put on with the benefit of hindsight. And I thought it worthy of discussion.

I fully agree with most of your comments. I think the aim of the short strangle (June 5125/4225) was to bring in premium so that the initial debit was minimal. I don't understand your comment about the position not going into profit until May. At the moment, the position is in profit at all levels above 4675, as shown in the 2nd of the two payoff diagrams. Selling more calls in near months could make this a free trade unless they go well ITM.
 
RogerM,

My comments are not a criticism of the trade but rather should serve as commentary to encourage traders to look at option strategies in a manner to uncover non-transparent risks and manage them accordingly.

Regarding the profit within the position. Perhaps I should have made it clear: the position is a long Call + a short Strangle. The profit the position currently enjoys is from the expired short Jan05 as well as the appreciation of the long Jun 4825C when the FTSE ran up 40 points to 4800. If we took these out of the combination the short straddle would in all likelihood not turn a profit unless IV has fallen. If IV is near, at or below its average the short strangle adds very little and the trader would be best served by trading the 4825C. One possibility would be to sell the 4825C and buy the 5000C ,i.e., add a Bear Call Sprd (BeCS) for a Credit, thereby taking some profit off the table but still remain in the trade in anticipation for the uptrend.

Had I been in this trade I would view the short strangle as a means of arresting IV crush, i.e., to protect the value of my long 4825C which I'd continue to use in my rolled Diagonal or BeCS. However, this view would only be valid if IV was abnormally high and there is a likelihood that it might collapse. If not, then I'd close the strangle and release margin for further trading positions.

An interesting point is that you imply that this position was put on as a spread bet. If so, does the firm provide reasonable (as in near market) exit fills? Second, do you know where one can find historical options data on the FTSE etc?
 
belinea03 said:
RogerM,

My comments are not a criticism of the trade but rather should serve as commentary to encourage traders to look at option strategies in a manner to uncover non-transparent risks and manage them accordingly.

Not taken as criticism. I'm just glad that my post has been a catalyst for intelligent debate! :)

Regarding the profit within the position. Perhaps I should have made it clear: the position is a long Call + a short Strangle. The profit the position currently enjoys is from the expired short Jan05 as well as the appreciation of the long Jun 4825C when the FTSE ran up 40 points to 4800. If we took these out of the combination the short straddle would in all likelihood not turn a profit unless IV has fallen. If IV is near, at or below its average the short strangle adds very little and the trader would be best served by trading the 4825C. One possibility would be to sell the 4825C and buy the 5000C ,i.e., add a Bear Call Sprd (BeCS) for a Credit, thereby taking some profit off the table but still remain in the trade in anticipation for the uptrend.

I think most traders would view the possibility of a significant fall in IV from what are already historic lows as a low probability event, and one worth risking in this low IV environment. I agree that you could nail down the profit accrued in the 4825 and buy a call with a higher strike price. Do you really mean buy the 5000 call (American Option), or the 4975 or 5025 (European options)?

Had I been in this trade I would view the short strangle as a means of arresting IV crush, i.e., to protect the value of my long 4825C which I'd continue to use in my rolled Diagonal or BeCS. However, this view would only be valid if IV was abnormally high and there is a likelihood that it might collapse. If not, then I'd close the strangle and release margin for further trading positions.

But although over 90% of the premium in the short 4225 put has gone, enabling it to be bought back for next to nothing, the June 5125 short call would be showing a loss - currently 63 to buy back (39.5 premium received). Given the rise in the FTSE, it is indeed debatable as to what the short strangle has brought to the party. A straight forward long call would have done just as well. But we didn't know that at the outset. The index had been trending sideways(ish), and had it continued to do so, the 4825 long call would expire worthless, having cost 125. Adding the strangle and the January short call has reduced the debit to 29. It's interesting to see that you look at the remaining strategy as a short strangle and a long call. I look at it as a vertical call spread, partially paid for by a short put. These are technically the same, but maybe reveal a difference in outlook?

An interesting point is that you imply that this position was put on as a spread bet. If so, does the firm provide reasonable (as in near market) exit fills? Second, do you know where one can find historical options data on the FTSE etc?

I've no idea whether it was placed as a spread bet. I've PM'd you re FTSE back data.
 
Roger,
Thanx for ur input and ur comments on this put-call strategies.
I totally agree that the sensable thing to do is to buy back the june 4225 put for peanuts while the footsie is over the 5050 level, incase of a sharp fall.
This will leave only 2 position open in the june calls contracts, the position would now look even better if the footsie goes to 5125 level for june xpiry. :LOL:

[as for the 5000 calls-puts they dont exist anymore]

bull
 
Happy to learn I have not offended anyone's sensibilities. :)

When I design a posiition, particularly using complex or hybrid strategies, I usually also analyse to synthetic position then ask myself: would you be happy to place this trade? In some cases I find that the resultant strategy masks the fact that I'm selling a 6 month strike for as little as 5 cents!! I say this to reinforce the point that "your" posiition as place is synthetically a Long Call + short 5 month Strangle. When analysed in this manner the risks, traps and profit mechanisms become clearer.

The position can also be analysed as a BuCS + Short Put and would yield the same results. The current profit seen in the position is predominantly from the expired Diagonal. Future gains should the FTSE continue to rise will be from the short Put losing value. Gains in the Long 4825C will be offset by losses in the Short 5125C. The BuCS will only come into its own when theta decay begins to take effect with 30 - 45 days left in the position, hence my May05 forecast.

The above analysis has very little to do with hindsight. It's more about the workings of derivative options. I would advocate the following strategy/philosophy: have an opinion on market direction then employ and options strategy consistent with that view in order to manage risk and gain acceptable returns. In the case under review:

(1) If bullish opt for a long Call or Diagonal

(2) If market is seen as consolidation place a near term short strategy, e.g., the short strangle. A 6 month short strangle will only make your spread bettor/market maker richer that (s)he already is.

(3) Its not advisable to combine (1) and (2) above as the margin requirement far outweigh the 69p you saved on the Diagonal.

Finally, I recommended the 5000C to illustrate to point about rolling to take some profit but still be in the trade if your bullish view hold. Any higher strike with acceptable premiums that produces an attractive risk-reward graph will do.

Hope this helps.
 
Belinea

There are numerous way in which to dissect this trade. You are quite right that it will dissect as a;

(1) a long 4825/4875 Jan/Jun Diagonal @ 98 Debit
(2) a short 422/5125 Jun Strangle @ 69 Credit

It will also dissect as a;

1) Long June 4225 / 4825 split strike synthetic
2) Short a June 5125 Call

Then perhaps considered as a separate trade – 3) Short a Jan 4875 Call. I’m sure there are more possible “dissections”, but that’s not my point.

My point is that I’m not sure it’s worth dissecting the trade purely to give each component part a name, well maybe just for interest. But I must strongly disagree in your suggestion of analyzing each component part for risk, when actually the only safe way to analyze would be to look at the entire spread.

As an example, you take the diagonal in isolation and go on to say (quite rightly)

“The risk in the trade is IV collapse and a downturn in the FTSE below the breakeven”

Which of course is true – for the diagonal, but NOT the entire spread. The entire spread is Vega negative and an IV collapse will benefit the spread. Directionally, when the spread was opened, it was delta neutral so a sharp move up would be as harmful as a sharp move down. You could take it the next step further and analyze each individual option – do you see my point ?

I’m not picking holes in your analysis, far from it, I’m pointing out the pitfalls of dissecting and then analyzing each bit in isolation.
 
Profitaker,

Contray to your statement I did not dissect each bit and analyse risk in isolation. I dissected, isolated then ADDED the bits to assess the position as a whole:

"Combining both positions results in a +theta, -gamma and small or neutral vega position. When the short position expires in Jan05 the resulting trade is a Bull Put Spread plus a short Put - a very bullish trade."​

Because the relationship between strikes are additive we can analyse the parts then sum them to get the behaviour of the whole (except for strikes in different months and then we can come up with a rough approximation). It's this additive relationship that allows us to easily draw risk curves and calculate breakeven points. To parapharse the advice give to Emanuel Derman, former head of Quant Research and Managing Director at Goldman Sachs,


“In this job you really need to know only four things: addition, subtraction, multiplication and division — and most of the time you can get by without division!” :LOL:

The idea is to dissect the position into a synthetic that highlights the strengths and weaknesses of the position. The +Call / -Strangle after the Jan05 expiration did this most clearly. The BuCS / -Put would have been less clear, however, each arrived at the same conclusion.

In adopting my approach the method is to dissect, isolate then combine to get the true picture of the position. This approach would only serve to strengthen any trading plan.
 
Hi Belinea

Read your post re: Cottle on the Book thread. Now perhaps I see where your enthusiasm to dissect complex spreads comes from...maybe ?

I maintain that we need to look at the entire characteristics and associated risk of any spread we trade - and if you're in agreement with that statement then you must surely also agree there is little point dissecting. Maybe if you were trading in the pit with just bits of paper then I can absolutely see the logic and usefulness of dissecting a total position to analyze the bits. But not if you have access to computers that will instantaneously give you all of the spread intricacies.

Perhaps Cottle wrote the article on dissection with his Market Maker hat on (?), whereby he would be constantly hit with buyers / sellers of different strikes / quantities / and so on. Dissection certainly would be useful in that arena.

But I’m not a Market Maker so have no need to dissect any spread. After all, if I put a spread together then I already know it’s component parts. You don’t build something yourself then take it apart to have a look at it. With a MM it’s no doubt a different kettle of fish, but he is on the other side of the counter to me and will trade differently and have different techniques – dissection being one of them.

But if you have the time or inclination, I'm open to persuasion…
 
Hi Profitaker,

Sure I'll continue the discussion. Who knows ... maybe you'll convert me :cheesy:

Dissection is a method used not only by Charles, but also by a number of famous traders and options experts. For example, Natenberg uses the method to draw risk graphs for very complex (convoluted) positions. The method is very useful when you're analysing/evaluating other trader's positions, particularly if there has been a number of adjustments over time. The point is that the method allows a trader to uncover non-transparent risks and then proactively manage said risks. Dissection utilises knowledge relating to Synthetics, the Greeks, Strategies ... you get the point.

Market Makers (MM) and Floor Traders (FT) use the method but that does not mean it has no relevance to retail traders. In fact, it's probably systems and tools like this that separates them from the retail trader. If this is what helps to give the MM and FT the edge to consistently make profit then I want in.

I can't vouch for Charles' mindset (was he writing as a MM?) when he wrote, "Coulda, Woulda, Shoulda" - which I might add has countless lessons for the retail trader. What I can suggest is that you ask him in person. He'll be giving a one-off lecture at King's College in London on April 4. Details are on this board or can be obtained by typing "Charles Cottle" in the Google search engine.
 
Top