robster970
Guest Author
- Messages
- 4,567
- Likes
- 1,390
After a couple of posts on FoMo's thread on using a simple trading strategy, I thought I would post up some basic facts about this set-up. There are some pre-conditions though:
Precondition 1 - This is largely dependent on you having done a lot of screen time and knowing your market well. This is because looking for price, trailing off over time with a volume spike indicating that it's not likely to go further requires context on the current conditions.
Precondition 2 - This is not a system and it is aimed at those with some discretionary skills or those who have a discretionary bent.
If you have little to no experience, do not be surprised if this does not work. If you are looking for easy money, you will not find it here. If you want somebody who is going to teach you how to trade, you will be disappointed in what you get here.
Alternatively if you are interested in developing your own skills to identify when something similar to this is happening on $ES_F or any other exchange traded security where volume is available, then you have something that will stand the test of time under almost all conditions (upto about 30 on VIX and then I would opt out). It works in both directions because order flow is order flow, liquidity is liquidity and value is perceived at tops and bottoms. You just need to remember the asymmetry of the market where price falls a lot quicker than it rises.
Teh Method:
1) Switch to an exchange traded product so you can see volume.
Volume is the context for a price movement. If you cannot see volume you are more likely to get the context of the situation wrong. When price reaches a high, has it stopped there because nobody wants to trade at that price or is it because somebody is heavily trading at that price using limit orders because they have determined that this is value for them? This is a big difference and shapes how you engage in the trade. Somebody hoovering up the market is a very different tell to nobody wanting to play.
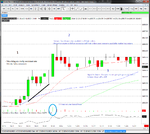
2) Wait for a trend to emerge.
Initial directionality is important as it implies a continuous imbalance in the orderflow in a particular direction. It might be being caused by long term traders (a big trend day) or more often than not, short term traders playing follow the leader and unloading into those less gifted at trading. However in either case it is a force that would need >= and opposite force to stop if a price considered value is reached. This implies somebody with money would need to stop this move. If the market is chopping, nobody is playing.
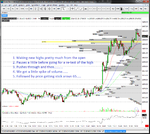
3) When price gets sticky, confirmed by a volume spike, fade the move that got it there (short for a uptrend, long for a downtrend)
The volume spike is a tell. In this situation it is saying that somebody with quite sizeable cojones (like our squirrel) is hoovering up the market orders at this price. As price is not moving and volume is going up, the initial directional force has met an equal and opposite force. You probably want to be on the same side of the market as the money here.
4) Place stop just below the highest(short), lowest(long) point.
The money didn't want to trade higher or lower than this point - trade with them.
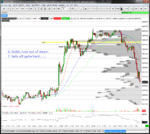
5) Exit mgmt: Trail on 15min or follow the mantra "What gets you in, gets you out"
Auction rotations on $ES_F are anywhere between 1.5-4 points typically for a 15 minute period. Stay behind the rotations so you don't get taken out. If all goes well you will see somebody else start hoovering up the market orders and you have a choice to bail or reverse.
6) Rinse and repeat. Any timeframe.
This phenomena occurs almost on all timeframes. However the higher the timeframes, the deeper the pockets you need to play and this is reflected in the size of participant you are dealing with in the market. This is why you should always look at charts from high to low - you see where the big boys are playing and you should generally be trading with them.
Teh Returns
You can double your account in 3 months trading like this intraday off roughly 1 trade per day using 2-3% risk per trade and stop set at 6-8 ticks on ES. Obviously I am referring to somebody doing between 1 and 50 contracts per trade which is the world I have lived in. Above this, I could not guarantee what would happen but I think you could take this to 200 contracts without it being problematic.
Teh Style
This style has more in common with fishing with large periods of boredom interspersed with the occassional trade. Trick is being selective, entry timing (requiring patience) and having the maturity to let it run when it goes. You do have to be vigilant in the RTH session but it is certainly less frenetic and more commission friendly than the intraday style I had 3 years ago.
SPECIAL NOTE TO MODS AND ADMIN
I am happy with people having some lulz on here and posting up pictures of people eating popcorn when somebody is having a b1tch fight, the girl in the yellow crochet bikini of course, the bishop going long 2 ES contracts, squirrels, etc so please don't feel compelled to tidy up on my behalf.
Precondition 1 - This is largely dependent on you having done a lot of screen time and knowing your market well. This is because looking for price, trailing off over time with a volume spike indicating that it's not likely to go further requires context on the current conditions.
Precondition 2 - This is not a system and it is aimed at those with some discretionary skills or those who have a discretionary bent.
If you have little to no experience, do not be surprised if this does not work. If you are looking for easy money, you will not find it here. If you want somebody who is going to teach you how to trade, you will be disappointed in what you get here.
Alternatively if you are interested in developing your own skills to identify when something similar to this is happening on $ES_F or any other exchange traded security where volume is available, then you have something that will stand the test of time under almost all conditions (upto about 30 on VIX and then I would opt out). It works in both directions because order flow is order flow, liquidity is liquidity and value is perceived at tops and bottoms. You just need to remember the asymmetry of the market where price falls a lot quicker than it rises.
Teh Method:
1) Switch to an exchange traded product so you can see volume.
Volume is the context for a price movement. If you cannot see volume you are more likely to get the context of the situation wrong. When price reaches a high, has it stopped there because nobody wants to trade at that price or is it because somebody is heavily trading at that price using limit orders because they have determined that this is value for them? This is a big difference and shapes how you engage in the trade. Somebody hoovering up the market is a very different tell to nobody wanting to play.
2) Wait for a trend to emerge.
Initial directionality is important as it implies a continuous imbalance in the orderflow in a particular direction. It might be being caused by long term traders (a big trend day) or more often than not, short term traders playing follow the leader and unloading into those less gifted at trading. However in either case it is a force that would need >= and opposite force to stop if a price considered value is reached. This implies somebody with money would need to stop this move. If the market is chopping, nobody is playing.
3) When price gets sticky, confirmed by a volume spike, fade the move that got it there (short for a uptrend, long for a downtrend)
The volume spike is a tell. In this situation it is saying that somebody with quite sizeable cojones (like our squirrel) is hoovering up the market orders at this price. As price is not moving and volume is going up, the initial directional force has met an equal and opposite force. You probably want to be on the same side of the market as the money here.
4) Place stop just below the highest(short), lowest(long) point.
The money didn't want to trade higher or lower than this point - trade with them.
5) Exit mgmt: Trail on 15min or follow the mantra "What gets you in, gets you out"
Auction rotations on $ES_F are anywhere between 1.5-4 points typically for a 15 minute period. Stay behind the rotations so you don't get taken out. If all goes well you will see somebody else start hoovering up the market orders and you have a choice to bail or reverse.
6) Rinse and repeat. Any timeframe.
This phenomena occurs almost on all timeframes. However the higher the timeframes, the deeper the pockets you need to play and this is reflected in the size of participant you are dealing with in the market. This is why you should always look at charts from high to low - you see where the big boys are playing and you should generally be trading with them.
Teh Returns
You can double your account in 3 months trading like this intraday off roughly 1 trade per day using 2-3% risk per trade and stop set at 6-8 ticks on ES. Obviously I am referring to somebody doing between 1 and 50 contracts per trade which is the world I have lived in. Above this, I could not guarantee what would happen but I think you could take this to 200 contracts without it being problematic.
Teh Style
This style has more in common with fishing with large periods of boredom interspersed with the occassional trade. Trick is being selective, entry timing (requiring patience) and having the maturity to let it run when it goes. You do have to be vigilant in the RTH session but it is certainly less frenetic and more commission friendly than the intraday style I had 3 years ago.
SPECIAL NOTE TO MODS AND ADMIN
I am happy with people having some lulz on here and posting up pictures of people eating popcorn when somebody is having a b1tch fight, the girl in the yellow crochet bikini of course, the bishop going long 2 ES contracts, squirrels, etc so please don't feel compelled to tidy up on my behalf.
Last edited: