You are using an out of date browser. It may not display this or other websites correctly.
You should upgrade or use an alternative browser.
You should upgrade or use an alternative browser.
FetteredChinos
Veteren member
- Messages
- 3,897
- Likes
- 40
twalker said:What would you change?
my underwear?
would need to after seeing some of those drawdowns...
hmm, i seem to recall from looking at stochs that on a 5,5,5 setting , an extreme of 100 or 0 provided a resonable entry point. ie buying when stochs hit 0, and selling when it hits 100.
doesnt happen often though on a 5 min chart...
perhaps you could try that?
FC
TWI
Senior member
- Messages
- 2,562
- Likes
- 269
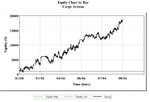
Bit short on signals then, maybe because i am using the SlowD on a Slow Stoch. Never seems to get to those extremes. 20/80 is not generating more than 10 trades in the period but it stays in so equity curve for a large portion reflects just the dow movement.
FetteredChinos
Veteren member
- Messages
- 3,897
- Likes
- 40
looks like a belter tw...
amazing how optimisation can affect system "performance"...
in terms of smoother equity curves, the smoothest ones i have found tend to be counter-trend systems, with some sort of hedging built in..
there are some corkers out there if you want to spend enough time in front of excel....
FC
amazing how optimisation can affect system "performance"...
in terms of smoother equity curves, the smoothest ones i have found tend to be counter-trend systems, with some sort of hedging built in..
there are some corkers out there if you want to spend enough time in front of excel....
FC
jmreeve
Well-known member
- Messages
- 432
- Likes
- 13
TW-
Now you can make a mint from selling it on the web along with all the other optimised systems out there.
FC-
Agree countertrend systems can have smoother equity curves as they tend to make smaller profits more often. However, I have found combining trending and counter trend systems in a portfolio gives the smoothest equity curve and sharp ratios > 2 can be achieved like this.
FetteredChinos
Veteren member
- Messages
- 3,897
- Likes
- 40
i mean other markets mainly...
for example, one that i continually toy with is the DOW/FTSE differential in absolute terms, not % difference.
ie, plot the difference between the DOW/FTSE , and apply indicators, or whatever system you fancy to it. the go short dow/long ftse or vice versa. it tends to smooth out the equity curve a treat.
i had a look at one that Glenn came up with. i think he posted the equity curve on here somewhere. although optimised somewhat, it did have some serious potential....
experimentation is the name of the game..
FC
TWI
Senior member
- Messages
- 2,562
- Likes
- 269
TW-
Now you can make a mint from selling it on the web along with all the other optimised systems out there.
No why would I want to do that when I am obviously going to be so very rich by trading this system in a few months with all my compounded profits. 😡
All in an afternoons work.
twalker said:No why would I want to do that when I am obviously going to be so very rich by trading this system in a few months with all my compounded profits. 😡
All in an afternoons work.
All,
Sprry about the "taking the P**S" remark, just looked that way but now i see that was not the case. Ok so from the posts i see the system is not quite right, back to the drawing board then i guess. I will try a few paper trades with this and let you know how i go, will note all the changes i make and then come back and let me know what you think.
Also did i mention this is only for day trading not swing, you should not be holding the trades for a long period of time.
Thanks again all
CarpeUK
twalker said:Carpe,
Would you then always exit at the end of the day or week?
Let me know your thoughts and I will run it through the system see how it develops.
Twalker,
No, you should only be holding the trade for a short period. let me give you a breakdown of what I am talking about, I have also attached a copy of an image of a 2 day chart of the FTSE 100 and I have circled the possible 20/80 overbought/oversold, this should give you a better understanding of what I am trying to do.
If you go to any of the indices and set your chart to the settings in the first post, you will notice this can happen a lot during the day, on all indices.
The only reason I have been unable to test this is I need live/streaming/real-time charts with no delays as you need to see what is happening as and when. Bigcharts.com has a 15min delay so it is very tricky when trying to apply this strategy.
Anyway, here is a break down of what I think you should be doing.
Once the indicator reaches above 80 and begins to turn down enter the trade. As I said before I have not worked out an exit for this yet so if you have any ideas please let me know. (My idea now is to get out before the trade falls below 20 then you can place another trade to catch the up turn)
Also, apply the same for the reverse. When the indicator reaches below 20 and begins to turn and rise then enter the trade again.
Anyway take a look at the chart and let me know what you think, have a totally lost the plot with this or is it possible...heheheheh
Regards
CarepUK
Attachments
The only reason I have been unable to test this is I need live/streaming/real-time charts with no delays as you need to see what is happening as and when. Bigcharts.com has a 15min delay so it is very tricky when trying to apply this strategy.
CarpeUK,
not mutch of a delay with the dow on big charts 😉
dbphoenix
Guest Author
- Messages
- 6,954
- Likes
- 1,266
CarpeUK said:The only reason I have been unable to test this is I need live/streaming/real-time charts with no delays as you need to see what is happening as and when. Bigcharts.com has a 15min delay so it is very tricky when trying to apply this strategy.
Unless you've left something out, it shouldn't make any difference. The delay is irrelevant.
Similar threads
- Replies
- 2
- Views
- 3K