donno1580
Junior member
- Messages
- 31
- Likes
- 7
Hi all, getting involved and contributing after more than 3 years of surfing, and frankly tired of all the write up's/videos on You Tube based on historical performance(What the chart/instrument did) as though it will happen time and time again!
I contribute the following..
1. There is no pattern to Currency Trading other than that prices go up and down, based on traders input.
2. There is no "Holy Grail" setup/indicator, my Spam box is full of supposedly magic offers of setups guaranteeing to make me very wealthy.. AS LONG as i pay for the offer!
Every day there are new offers from the same/ new stream of Vendors with other fancy looking indicators or trading robots that guarantee the same results as the last ones... as long as i pay!!
If these offers were so good anyway then why bother everybody for money if they could get on with it and make millions of their own?
3. Fundamentals and Technical analysis..is what drives the pairs against one another.
4. Trading lower time frame charts are suicidal WITHOUT higher time frame consideration.
In saying that, i offer my strategy that uses multiples of a favorite Moving Average among Traders namely the SMA50 (50 period Simple moving average)
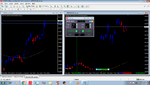
Take a One Hour chart and slap a SMA50 and a SMA200 onto it.
Why a SMA200? well the SMA200 on the H1 chart is the same as a SMA50 on the H4 chart (50*4=200}
Now You have higher time frame reference.
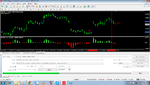
Now take a 600SMA and slap it onto a M5 chart. (SMA50 on the hour chart, Sma100 on the M30 chart..SMA200 on the M15
chart and the M5 is three times lower than M15 therefor 3*200 = 600
Now you have got an M5 chart that is that is the same as he H1 chart with a SMA50 on it.
Well if i don't get shot down, i would be glad to continue with my lower time fame entry strategy.
I contribute the following..
1. There is no pattern to Currency Trading other than that prices go up and down, based on traders input.
2. There is no "Holy Grail" setup/indicator, my Spam box is full of supposedly magic offers of setups guaranteeing to make me very wealthy.. AS LONG as i pay for the offer!
Every day there are new offers from the same/ new stream of Vendors with other fancy looking indicators or trading robots that guarantee the same results as the last ones... as long as i pay!!
If these offers were so good anyway then why bother everybody for money if they could get on with it and make millions of their own?
3. Fundamentals and Technical analysis..is what drives the pairs against one another.
4. Trading lower time frame charts are suicidal WITHOUT higher time frame consideration.
In saying that, i offer my strategy that uses multiples of a favorite Moving Average among Traders namely the SMA50 (50 period Simple moving average)
Take a One Hour chart and slap a SMA50 and a SMA200 onto it.
Why a SMA200? well the SMA200 on the H1 chart is the same as a SMA50 on the H4 chart (50*4=200}
Now You have higher time frame reference.
Now take a 600SMA and slap it onto a M5 chart. (SMA50 on the hour chart, Sma100 on the M30 chart..SMA200 on the M15
chart and the M5 is three times lower than M15 therefor 3*200 = 600
Now you have got an M5 chart that is that is the same as he H1 chart with a SMA50 on it.
Well if i don't get shot down, i would be glad to continue with my lower time fame entry strategy.
Last edited: