This week's DOW 26/11-30/11

ChartMan

Legendary member
Messages
5,580
Likes
47
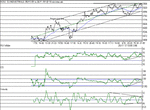
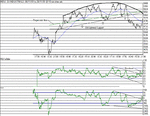
Just how many more attempts at breaking the magic 10K I don't know.The 100MA moved up another 40 pts to 9923. Uptrend support ay 9864,Horizontal support at 9964 and 9900, Resistance- as close to 10K as you can get....
A quick rise from open to test 10K set the tone for the day.A drop to support at 9900 preceded several attempts to break the 10K, all failing. A strong wedge has formed and there is an increase in the rising trend line angle.This should be enough to see us through tomorrow.
On the downside, we could still drop to the channel bottom at 9800, wich is currently firmly established.
Although the current indicators are showing negative divergence, there are overall, triangles forming on most of them, which will lead to a breakout in one direction. Which way? I'll hedge to the upside.
 

Attachments

  • dow261101.gif
    dow261101.gif
    14.5 KB · Views: 613
Dow chart

Chartman
Is there some wayI can print off your charts without printing off the whole thread of several replies?

Also, I follow signalwatch.com since I find I can learn more about TA at the coalface from the likes of Ed Downs and your charts.

Regards
Neil
 
I f you let me have your email address, I will send you the giff.....
[email protected]

Or if you get the image you want on the screen, press " ALT + print screen" keys, and that will copy the screen image to your clipboard. Then "paste" it into MS Paint, or paint shop pro....
 
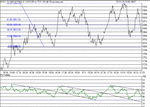
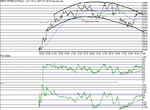
Bit of a roller coaster today. Big volatility, big bucks for the brave. Almost 450 points in 3 150 point swings.I thought it was all over when 9850 support was lost, but then it recovered to have another pop at 10K, finally dropping to close at 9872.We are still firmly stuck in a trading channel, but there are signs of an early bull wedge forming. 100 MA sitting right on 9908 support.
The down channel on the indicators is the thing to watch here. A breakout from that will give a good indication of direction. That can't be seen from the price action. The rounded top formation is becoming evident again, though the recent higher lows off 9800 makes one wonder if the bulls are slowly getting the upper hand.
Still no clear sign either way.
 

Attachments

  • dow271101.gif
    dow271101.gif
    13.9 KB · Views: 546
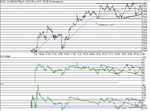
Well the signs were there- in the shape of the "rouded top" . Support got broken at the open and that was the end of the trading channel. A quick false break above 9800 and off we slid to 9700 closing just off the bottom.
Minor support at 9700, then 9600. 100MA at 9828
I guess the party is now officially over and it's just a question of how far. EOD chart shows good support at around 9600.....
 

Attachments

  • dow281101.gif
    dow281101.gif
    15 KB · Views: 532
What a turn round today :)
Just when I thought it was all over, we get a (temporary?) recovery.
Two important things happened today. Firstly, the long term down trend met the shorter term uptrend and crossed at 9689. Secondly, we bounced off that point at 9691.
From that bounce a bull wedge formed, and we had an excelent closing rally from the break at 9760, to close at HOD 9829, and more importantly above the 100MA at 9782, just before the close.
I suppose it was on the cards, given the positive divergence in effect all of yesterday on the 10 min chart.The TA down channel has been broken to the upside, which I said yesterday would give us a direction- that we now have.The next target up will be the recent up-trend line, currently at 9890.The extrapolated "rounded top" resistance line is at about 9870, and breaking that will be significant too.
Tomorrow, we need to hold above the recent support line across 9800 to stay in a new uptrend, and recapture the dizzy heights of 10K. Note the regression line is close to the uptrend line, which gives a good clue as to likely direction.Having played with the regression line over that past few nights, it has become obvious that the DOW has a natural tendancy to diverge towards it. Interesting....
 

Attachments

  • dow291101.gif
    dow291101.gif
    15.5 KB · Views: 473
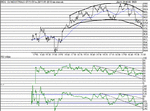
No suprises today, for a change. Nice steady uptrend, with a small rally to test resistance at 9900 (9890 twice) and sell off to the close, closing up 22 . The 100MA closed to finish the week at 9826.The DOW finished the week down at -133. Although we have finished on a relative high over the last few days, we are still (just) under the umbrella of the "Rounded Top", although there was a minor breakout from this towards the close. This is my biggest concern for a breakout to beyond 10K. A positive move above yhis line would be very encouraging, to say the least.
It is also possible that the trading range has now dropped a 100 points, from 8000- 10,000 to a new range of 7000-9000.
Still no clear direction, but little prospect of the psycological 10K breakout...yet.
Resistance 9900, support 9700. Minor support 9800.
From an EOD viewpoint, yesterday's and today's close was right on the 7Day MA, a value I favour for longer term buy and hold (several days) . This is an "indescision point", with no clue for direction. Monday's close should change that. If I had to chose, it would be long, on the basis that we have had a bounce off the short term up trend support line from 21st. September.
 

Attachments

  • dow301101.gif
    dow301101.gif
    13.9 KB · Views: 444
Top