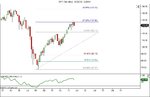
Nice chart. I am a Fibonacci trader myself and what's happening right now is that the S&P is hanging right at a 1.272 extension of the last swing (chart attached). The market has been hanging out around this range for several months as you can see. Although I've been short (position trade) since we hit that area a few months ago, I am watching it carefully to see it it closes above the 1.272 extension (on the monthly). If that happens, then we we likely see a 1:1 move that puts you at around 155 on the SPY.
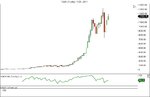
In terms of what I'm looking for bigger picture really depends on how the year finishes. The yearly chart on the DOW is what is most interesting to me right now. The close that happens comes Dec 31, 2011 is going to have big implications going into 2012. So considering where we are now is HUGE if you ask me. A hold here and a pull back could result in a bearish close for the year. A break above the 1.272 and we could quickly see a move to the 1.618 would could mean we see all time highs come 2012.
At this point I'm short as I mentioned and I've got stops above the highs with a target back down near the 2009 lows. I know it may sound crazy to some, but I'm just following the rules of my particular trade setup.
Should be interesting none the less.
Update: I've attached a chart of the DOW Yearly to give you a the bigger perspective what what i meant. If the the market(s) stop here and start to pull back, imagine the yearly close and what that could mean for 2012.
Again, for me, I'm just trading my rules and sticking to my trading plan.