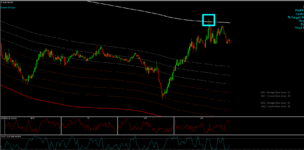
There are hardly any guaranteed edges in Forex trading - but here's one that will never fail.

ChartSmart

Junior member
Messages
11
Likes
6
Price always returns to it's average.

Always.

If this is true and we can figure out when it is most likely to happen, we have a strong edge on market behavior that has always and will continue to always play out

So what needs to be considered?

Well a lot of traders will tell you distance from the average is key. So if price is much further away from the average than normal, it will probably return to it fairly soon.

Of course this is nonsense. Complete and utter drivel.

On its own, distance from the average tells us nothing apart from the fact that we are in a strong trend or maybe experiencing a significant news event.

A better measure than distance travelled from the average is TIME spent away from the average compared to how long price normally spends away from the average.

Remember, if price always has to return to it's average, which it does, then the longer it has spent away from the average compared to normal, the higher the probability of it returning to the average sooner rather than later becomes.

This combined with distance from the average now starts to give us a very powerful indication of whether price is likely to return to the average sooner rather than later.

The last element which I won't go into to much detail as it starts getting a bit mathsy is the Rate of Change of the average. We can discuss this later on, but it is critical to understand

So, if you are trading mean reversion back to the average of price remember - distance from the average is a start, but TIME spent away from the average is a far more useful concept to master.

Once we know price has spent to much time away from it's average we can start initiating positions to profit from it's return to the average.

Remember, price always returns to its average. Any average. Always.

All the best

Justin
Screenshot_3.png
Screenshot_7.png
Screenshot_8.png
Screenshot_9.png
Screenshot_1.png
 

Attachments

  • Screenshot_3.png
    Screenshot_3.png
    43.2 KB · Views: 305
Great! So now you should link/migrate your trading account to Darwinex and open a Darwin (Financial Asset FCA Regulated), thus we could see if this track-record is built with a sane strategy.

If yes, you could have a lot of investors a manage millions easily.
 
Its an interesting concept and in forex at least it is a truism that all prices range, if you can only find a long enough time period.

I see a lot of ideas like this in which the system is run through a PC and every day it looks for the buy set-up and the sell set-up and it buys or sells accordingly. But it never closes any position. So of course if you find a long enough time period for something like this (though not too long) the performance can look stellar in terms of win rate and total gain. But nobody trades like that.
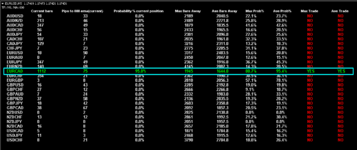
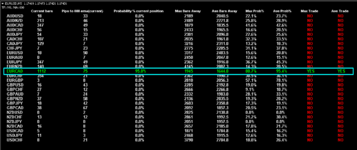
I have built software that scans the market and alerts me when a set up has been found. Those results posted above are all real trades and none of them were permanently open. The stats are very effective and with the right risk management this approach delivers consistent results
 

Attachments

  • EURCAD.png
    EURCAD.png
    34.5 KB · Views: 278
What about 2019 and 2020 ?
An active link would be better than a screenshot.
I have traded 3 strategies on 1 fxbook account and so don't have strict numbers for this approach apart from 2018 when i only traded this strat. I don't like sharing numbers anyway as no one believes they are real anyway and at the end of the day its irrelevant. I am simply sharing a concept that works in case it is of use to someone
 
There are many strategies that take the approach that price always reverts to average. VWAP trading is very much based on this and the key is knowing when to take a trade based on how far price has deviated from a determined average. So what is your criteria for that deviation ?
 
There are many strategies that take the approach that price always reverts to average. VWAP trading is very much based on this and the key is knowing when to take a trade based on how far price has deviated from a determined average. So what is your criteria for that deviation ?
I have 3 criteria: 1) Time spent away from the average 2) Distance travelled from the average 3) Rate of change of the average. All three of these factors then need to be compared to the averages and the extremes of these factors over a certain lookback period, say 250 000 bars on a 5 min chart. From here probability of trade outcome with a worst case scenario of break even can be calculated in real time and positions initiated with a statistical probability of success confirmed prior to entering the trade
 
I have 3 criteria: 1) Time spent away from the average 2) Distance travelled from the average 3) Rate of change of the average. All three of these factors then need to be compared to the averages and the extremes of these factors over a certain lookback period, say 250 000 bars on a 5 min chart. From here probability of trade outcome with a worst case scenario of break even can be calculated in real time and positions initiated with a statistical probability of success confirmed prior to entering the trade
Distance travelled from the average or mean is very seldom sufficient for any consistency in mean reversion trading. Strong trends will run you over if you catch them to early. That's why time is so important.
 
Glad to see someone has mastered the return-to-average mode of trading.
Going back several years, I did a number-crunch of similar methods, and all failed for me.
Interesting idea of "time-away" as a concept.
Subscribed to see what comes of this.
 
There is a problem with returning to average - it is eventually a self fulfilling prophesy, but the problem is it can take a lot longer than you think.
What about a casino roulette wheel? Over thousands of spins it will also 'return to average'. Lotto numbers drawn will also do the same but you can't build a strategy around it.
Big Deal you are right....understanding the time element is key as it can take longer than you think. But with the right data time becomes your key ally instead of a dangerous foe.
 
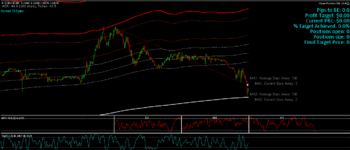
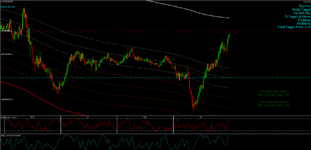
An example of a trade closed yesterday on the 5 min EURCAD chart trading back to the 800ema. Price had been away from the 800 ema for a statistically relevant time and at the distance from the mean and at the rate of change of the mean the overwhelming probability was that price would return to the mean.

Note distance from the mean needs to be understood in relation to ROC of the mean as this is your profit potential and by its very nature it diminishes over time. Time, Distance and ROC are the three legs of the reversion to mean table. If you remove one of those legs the table comes crashing down.
 

Attachments

  • EURCAD.png
    EURCAD.png
    34.5 KB · Views: 272
  • EurCad Profit.png
    EurCad Profit.png
    73.3 KB · Views: 298
  • Screenshot_1w.png
    Screenshot_1w.png
    65.3 KB · Views: 279
There is a problem with returning to average - it is eventually a self fulfilling prophesy, but the problem is it can take a lot longer than you think.
What about a casino roulette wheel? Over thousands of spins it will also 'return to average'. Lotto numbers drawn will also do the same but you can't build a strategy around it.

I agree it can take longer than one thinks, you can't predict the future, after all. But I think it is not correct to compare price movements to roulette or lotto as price movements are never completely random, therefore the things that affect each are completely different.
 
An example of a trade closed yesterday on the 5 min EURCAD chart trading back to the 800ema. Price had been away from the 800 ema for a statistically relevant time and at the distance from the mean and at the rate of change of the mean the overwhelming probability was that price would return to the mean. ...

The EMA value used determines whether the price is above the EMA and you're looking for a short, and a different EMA, on the same chart, may be below the price, and you're looking for a long.
So, the EMA chosen sets your expectations of a long or a short trade?

PS: I think I know why I am going to like this thread! :)
Yes, on any EMA the trade will always be back to the ema itself. So if price is above the ema the trade will be short and if price is below the ema then the trade will be long. The reality is that without the data its impossible to know which ema mean reversion is most likely to happen on. In your example above perhaps price must first move back to the shorter ema before going back to the longer. This is completely normal and not a problem, but the data will clarify which trade is a stronger set up
 
Does price return to average or does the average move to return to price?
Yes, great question! The answer is a bit of both. It is for this exact reason that we need to know the rate of change of the EMA when calculating probability of mean reversion
 
Top