The author looks at the Vix indicator and its use in predicting the market turn of 2002.
In the last 2 weeks, I have seen the "VIX" on both CNBC and Bloomberg TV talked about as if it was something new. Well, for all you OTA Grads, you know we have been using it for years. For the rest, let's review and see how this "new" indicator can help us.
Let's look back at the turn in the markets in 2002.
The VIX is provided by the Chicago Board of Options Exchange (CBOE) and, basically, measures the volatility in the options markets, which of course, are directly related to the underlying security in the stock market. VIX (generally, you can see this with the VIX symbol, but your platform may require a prefix or suffix such as $vix, /vix, vix.x, .vix or even ^vix. Each has it own requirements. Pretty much, whatever you use to see the Standard & Poor's 500 Index <SPX>, VIX will follow that format).
As volume, velocity and directional change start to go up in intensity, we measure this as "volatility". Historically, we see that when this range is under 36 points (nominally 20 - 35), the market is fairly calm and happy in its trend - up or down. However, when the VIX starts to move above the "36" line we start noting historical changes.
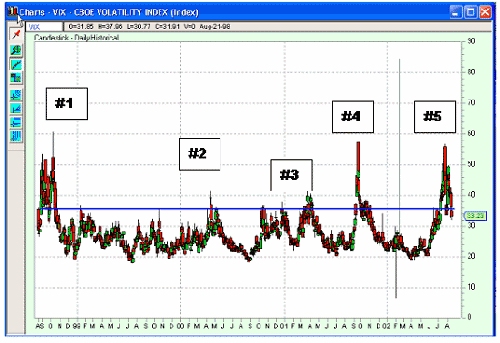
caption: Here's a 4 year, daily chart of the VIX. I have drawn in the blue "36" line. You can immediately see some changes in the market at the breakouts.
Lets look at some past data; at (1) Sept/Oct of 1998 - the Naz and Dow had been rallying all year long. In late spring, whispers of the "Asian Contagion" were going around. Would Japan recover or would their economy slip further into recession/depression? The market started to wobble. It hates uncertainty. As July blended into August, we found that Russia was defaulting on some IMF loans. So we had the "flu" and a monetary meltdown. The market reacted violently in Sept/Oct. It was a vicious drop from the 2000s on Naz to the 1400s.
VIX started peaking above 36 in the end of August and you can see that by Oct it was screaming above it. It was clearly signaling the turn in the market. Things were too crazy to the down side, it had to turn around. Once the "washout" was over, the markets recovered and you can see that by late Oct, VIX had dropped back to normal. The downward plunge was over, and the Naz started to re-establish its up trend.
caption: Here's a larger view of (1).
At (2) we see the VIX get above 36 and actually into the mid40s in Mar/Apr of 2000 - Hey, did anything happen then? What Tech Bubble?
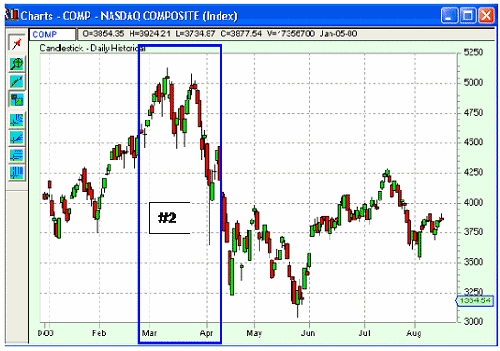
caption: A larger view of (2).
How about Apr/May of 2001 shown at (3). VIX started its thing. We got into the40s again. This is when everybody thought we had a "V" bottom from the bubble bust and the market rallied - OK, so it didn't last long, but VIX was telling us that downtrend had changed.
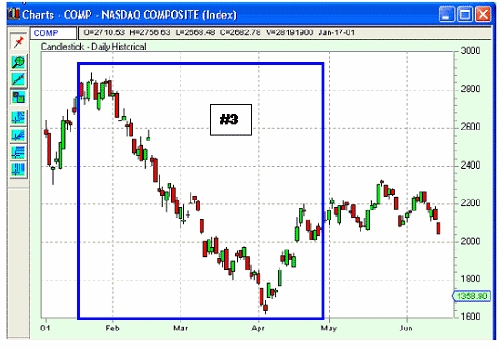
caption: A larger view of (3).
I will not be glib about (4). The tragedy of Sept, 2001 changed everything - our lives, our sense of security and our force of character. Needless to say, VIX was almost to 60! It certainly heralded a turn in the market and we had a 40 - 47% rally, depending on which index you were watching.
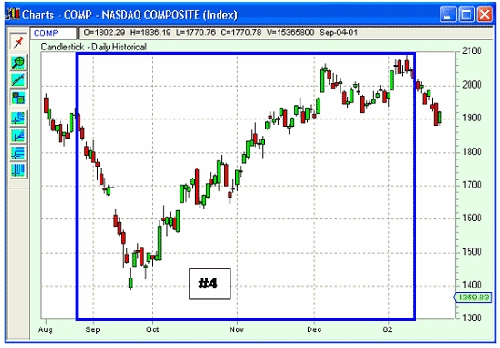
caption: A larger view of (4).
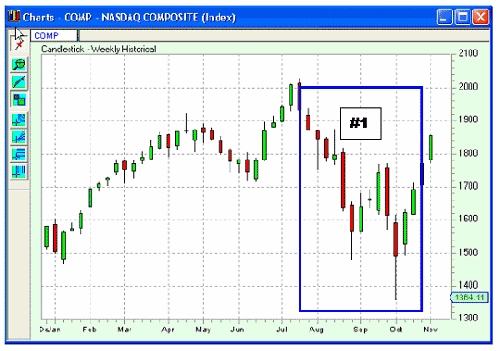
And finally (5). The VIX has been running above 36 for the better part of 3 weeks here and we "may" be able to look back at Jul 24 at "a" bottom, if not "the" bottom. However, VIX indicated a turn in the markets and that certainly did happen.
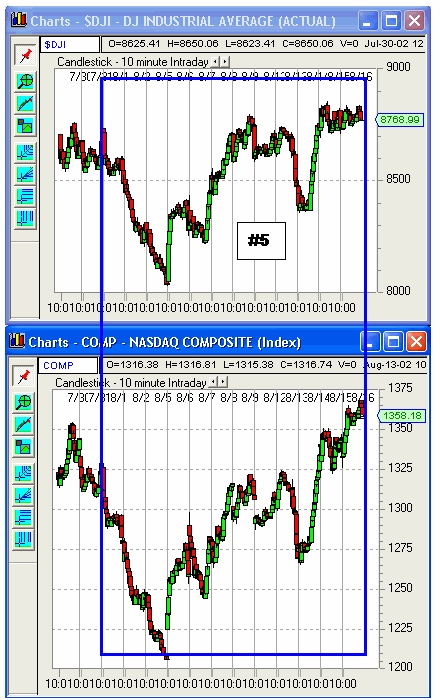
caption: A larger view of (5).
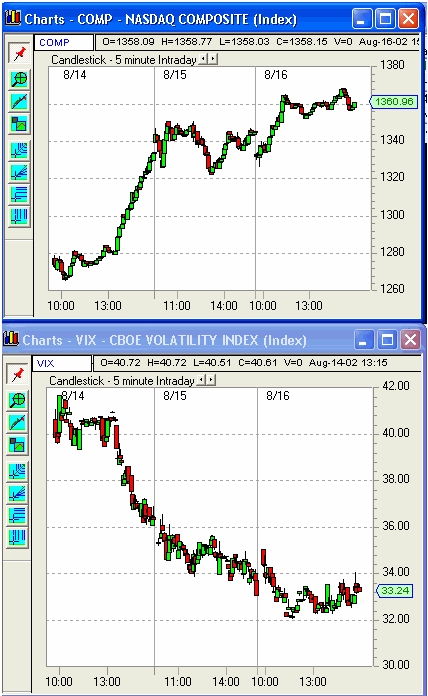
caption: In August 2002 the Vix starts to show a new uptrend in the Nasdaq composite.
The VIX can certainly help us all start changing our minds. It is easy to get caught up in a mental position as it did in 2002. Most of the good traders have been thinking "long" for over 3 years now. The VIX may help us see any turn that's coming a little earlier, thus, save us from some "wrong side" trades. It is only a Secondary indicator but a very powerful one. But don't let this one article (or CNBC, Bloomberg, etc) influence you into believing that the Bull Market is over and now is the time to sell. There are a lot of other indications that say we have some very choppy times ahead. Think like a trader and protect yourself.
Remember, "If you think you've seen the top, you're wrong - if you know you've seen the top, you're too late!"
In the last 2 weeks, I have seen the "VIX" on both CNBC and Bloomberg TV talked about as if it was something new. Well, for all you OTA Grads, you know we have been using it for years. For the rest, let's review and see how this "new" indicator can help us.
Let's look back at the turn in the markets in 2002.
The VIX is provided by the Chicago Board of Options Exchange (CBOE) and, basically, measures the volatility in the options markets, which of course, are directly related to the underlying security in the stock market. VIX (generally, you can see this with the VIX symbol, but your platform may require a prefix or suffix such as $vix, /vix, vix.x, .vix or even ^vix. Each has it own requirements. Pretty much, whatever you use to see the Standard & Poor's 500 Index <SPX>, VIX will follow that format).
As volume, velocity and directional change start to go up in intensity, we measure this as "volatility". Historically, we see that when this range is under 36 points (nominally 20 - 35), the market is fairly calm and happy in its trend - up or down. However, when the VIX starts to move above the "36" line we start noting historical changes.
caption: Here's a 4 year, daily chart of the VIX. I have drawn in the blue "36" line. You can immediately see some changes in the market at the breakouts.
Lets look at some past data; at (1) Sept/Oct of 1998 - the Naz and Dow had been rallying all year long. In late spring, whispers of the "Asian Contagion" were going around. Would Japan recover or would their economy slip further into recession/depression? The market started to wobble. It hates uncertainty. As July blended into August, we found that Russia was defaulting on some IMF loans. So we had the "flu" and a monetary meltdown. The market reacted violently in Sept/Oct. It was a vicious drop from the 2000s on Naz to the 1400s.
VIX started peaking above 36 in the end of August and you can see that by Oct it was screaming above it. It was clearly signaling the turn in the market. Things were too crazy to the down side, it had to turn around. Once the "washout" was over, the markets recovered and you can see that by late Oct, VIX had dropped back to normal. The downward plunge was over, and the Naz started to re-establish its up trend.
caption: Here's a larger view of (1).
At (2) we see the VIX get above 36 and actually into the mid40s in Mar/Apr of 2000 - Hey, did anything happen then? What Tech Bubble?
caption: A larger view of (2).
How about Apr/May of 2001 shown at (3). VIX started its thing. We got into the40s again. This is when everybody thought we had a "V" bottom from the bubble bust and the market rallied - OK, so it didn't last long, but VIX was telling us that downtrend had changed.
caption: A larger view of (3).
I will not be glib about (4). The tragedy of Sept, 2001 changed everything - our lives, our sense of security and our force of character. Needless to say, VIX was almost to 60! It certainly heralded a turn in the market and we had a 40 - 47% rally, depending on which index you were watching.
caption: A larger view of (4).
And finally (5). The VIX has been running above 36 for the better part of 3 weeks here and we "may" be able to look back at Jul 24 at "a" bottom, if not "the" bottom. However, VIX indicated a turn in the markets and that certainly did happen.
caption: A larger view of (5).
caption: In August 2002 the Vix starts to show a new uptrend in the Nasdaq composite.
The VIX can certainly help us all start changing our minds. It is easy to get caught up in a mental position as it did in 2002. Most of the good traders have been thinking "long" for over 3 years now. The VIX may help us see any turn that's coming a little earlier, thus, save us from some "wrong side" trades. It is only a Secondary indicator but a very powerful one. But don't let this one article (or CNBC, Bloomberg, etc) influence you into believing that the Bull Market is over and now is the time to sell. There are a lot of other indications that say we have some very choppy times ahead. Think like a trader and protect yourself.
Remember, "If you think you've seen the top, you're wrong - if you know you've seen the top, you're too late!"
Last edited by a moderator: