The author of A Complete Guide to Technical Trading Tactics: How to Profit Using Pivot Points, Candlesticks & Other Indicators, looks at a candlestick formation that can indicate reversal points when used with pivot points and support/resistance levels.
There are many trading methods one can employ to actively trade including various mechanical trading systems and manual trading tactics. The constant changing of market conditions can require system traders to adapt and update the parameters for the trading decisions. I often prefer the hands on visual approach which is more of a manual method while employing mechanical risk management techniques. The visual approach is aided by the use of candle charts. The draw back is one must have a basic understanding of this form of charting to begin with. The upside is once you learn the basics, a new meaning of how markets act may open up to you.
It amazes me that candle charting was one of the first forms of tracking commodity prices some 400 years ago, today it has become more popular, however, relatively few Futures traders implement it in their analysis. The myth surrounding this method is that it is a highly complicated means of charting. The fact is it is a relatively simple method and enhances the visual effects in charting. Candle Stick Charting is a basic building block method that immediately shows a trader the important connection between the four most important aspects of price analysis. That is the relationship between the Open, High, Low and close of a given session. It involves colors to differentiate the relationship between the open and close referred to as the real body, it acts as an immediate way to illustrate and help identify the current markets environment and the current time frames acceptance or rejection of a specific support or resistance level in a clear visual manner. If for example, on a given trading session prices move higher from the opening price, and close near the highs, it shows strong buying interest. If after the open the market trades up establishing the high and then fails, the distance formed from those points of interest is called the shadow, which clearly shows rejection from that high price level.
There is one more formation, called a Doji where there is no main real body formation as the market closes at nearly the exact level from where it opened. That is the focus of this article.
In my Book "Technical Trading Tactics: How to Profit using Pivot Points, Candlesticks and other Indicators" I demonstrate many powerful ways to anticipate support and resistance levels. The most reliable and common method used to determine those levels is the mathematical based calculations from Pivot Point Analysis. Through the years I have noticed that Doji formations form more often than not at these pre-defined levels. That is the focus we want to concentrate on. The markets behavior at support and resistance levels especially when Dojis appear. The key is watching for confirmation for a transition to take place and to act when there is a shift in momentum. We see a specific conditional change take place in the markets behavior, namely the market makes a higher high but establishes a higher closing high above a Dojis high at the Pivot Point support level.
In this article I want to share with you in detail this one specific trade setup and what it takes to confirm the buy signal or what's known as a trigger to execute a trade.
This is the pattern I call the High Close Doji or the HCD method. It has dimensions of specific criteria that need to fall in place, therefore helping to eliminate and filter out false signals. It is a simple and basic approach that is a high probability winning strategy.
This setup may help you improve your trading performance and allow you to develop a consistent winning trading strategy. Consider this your own personal trading system that is based off of proven and powerful techniques. For a moment I want you to envision the concept of epoxy glue, it requires two compounds. Separately they are not very reliable or in fact a very strong bonding substance. However, when combined, a chemical reaction occurs and forms an amazingly strong and powerful bond.
Using the methods of Candlesticks with Pivot Points can give you that same result if you know what to look for. The implementation of longer term analysis using Pivot Points will give a trader a fantastic means in which to anticipate a point from where a trend change could occur, thus helping one to not only prepare but to act on a trade opportunity.
The setup:
One can implement this set-up using different time frames besides daily analysis. You can include weekly and even monthly Pivot Point calculations. Take for instance the Weekly numbers. They are compiled from the previous weeks High, Low and Close. This method of analysis after calculating the numbers will alert you well in advance of a potential Support and or Resistance level. If you have your calculations figured out on the close of business on a Friday then you are prepared before the weekend starts and now have a general guide of what may be the next weeks potential High, Low or both.
In the setup process you heighten your awareness to enter in a long or short position against predefined levels and wait for the trigger or market signal at those levels.
It can not only help you define or identify the target area to enter but also what you wish to establish as your risk objective. Another event that occurs with this setup process is you now can "set up" your orders to buy on your trading platform with the selected contract amounts. In other words, prearrange the commands on the electronic order ticket. Now all we need is confirmation so you can pull the trigger or click the mouse to establish an entry in the market and establish a position.
The chart below magnifies what you are looking for, notice once the market closes above the Doji's high we see an immediate reaction of positive momentum and a continuation of higher prices.
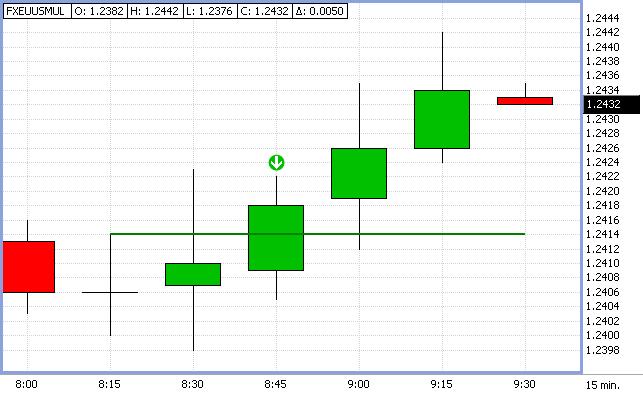
That is what we are focusing on especially after a decline in price and when the market approaches a predetermined support level based off of the Pivot Point Calculations.
Trading Rules for the HCD setup:
A bullish Candle pattern can be a Harami, Harami Doji Cross, Bullish Piercing Pattern, A Bullish Engulfing Pattern or my favorite, but in most cases we want to act on a High Close Doji pattern. This pattern works for most markets including Stocks, Forex and Futures. This is a high probability intraday trading pattern however it works very well for position trading. There is a higher frequency of patterns that develop for intraday trading.
This pattern develops on various time periods, however I do not use less than a 5 minute time period. My favorite day trading time frame is using both the 5 and the 15 minute period. This helps me to catch trend runs as they occur in the market.
The example below is the CBOT electronic Gold contract taken from September 28th 2005. The first dimension we need is the Pivot Point calculations. So we take the prior days High, Low and Close and applying the formula we derive at 466.50 as the first Support level known as S-1. Notice the price action at the support level. The Doji Forms at the S-1 and two times periods later, an engulfing green candle forms, which signifies the market closed above the open. Notice that it also closes above the Doji's high.
I want to illustrate the flow of the market price action, notice we never see, until the end of the trading session, prices make a lower closing low. The sequence of events that transpire is higher highs, higher lows, and higher closing highs as defined by green candles, all the way up just past the daily projected pivot Point R-1 of 472.50. This is a great example of a HCD trigger that results in a 6.00 dollar gain in Gold.

In case you were wondering if this set-up can be applied to Forex markets the answer is yes. This next chart is a spot FX British Pound from September 30th. If you apply the Pivot calculations derived from the prior days data you will have a predetermined support of 1.7568. Notice how the market bounces around and then the Doji forms. The trigger to buy initiates once the Green candle closes above the Doji high and the same sequence of events takes place, higher highs, higher lows and a continuation of higher closing highs all the way up until we hit resistance at the R-1 of 1.7680. That equates to nearly an 80 PIP or point gain.
This next example is the CBOT Mini-Dow contract, in this example notice how the Doji forms right on the Pivot Point Support Line. Remember that Dojis form more often than not at Pivot Point Support or Resistance levels. Here the candle right after the Doji not only closes above the doji's high but see how it entirely engulfs the real bodies of the prior two candles of the Doji as well. That helps signal the power behind the reversal formation. As you can see we have a great run in the market testing beyond the R-2 number thus giving nearly a 100 point gain for the trading session.
This is a pattern that should show an imediate positive change as the reversal takes hold. Also notice that we see more green candles develop, which reflects the market closing above the open, thus confirming buyers dominating the market with better bullish momentum.
The rules also state that we can use confirming indicators. In the chart below we have three indicators, my favorite being Fast Stochastics, then MACD and CCI. As you can see Stochastics indicates a bullish convergence signal, validating that prices were near an exhaustion phase and ready to reverse, as the Doji formed.
The HCD trigger would have you long at the close or the open of the next candle near 10485. However, notice the MACD triggers late and would initiate a position near 10520.
The trigger in the MACD would be verified from the moving average crossover as well as the zero line crossover method. Notice how MACD does not form a Bullish Convergence either.
The CCI indicator is a 14 period setting. The Histogram feature does alert to a timely Bullish Convergence confirmation, but notice when we line up the zero crossover feature it also would trigger a buy at a much higher price entry similar to the MACD signal. One of the neat features of CCI is that it incorporates the Pivot Point formula in its calculation; it has great validity as a confirming indicator. It is non the less a lagging indicator and as the chart below shows signals an entry later than the HCD trigger pattern.
No matter which indicator you are comfortable in using, when investors first discover </span />Pivot Points, most often their first impression is one of pure amazement. Mainly due to its ability to predict what a specific time frames overhead resistance or support might be. Moreover, more times than not the High, Low or even both are right on target as the exact number for that given session. Make no mistake Pivot Point analysis is impressive. However, its real power and value does not end there. Pivot Point Analysis deals with pin pointing not only price but in a specific time period.
It is what I consider the "Right Side" of the chart indicator. It also gives you a method for identifying the trend and how to determine the typical price or fair value of a given time frame. After all, that is what the actual Pivot Point number is. If prices deviate too far from that point the outer calculation numbers can help you determine at what point a market is most likely to turn. One can also use this feature of the actual Pivot Point to develop a moving average system. But when traders combine these calculations with the visual aid of certain candle patterns, it can give you superior guidance as to when and where to enter and exit positions. Traders who want every edge in their approach for the highest probability of success will benefit from this simple but yet time tested method.
This is just one of the strategies that I wrote about in my book, A Complete Guide to Technical Trading Tactics. Remember this technique works amazingly well for futures, commodities and stocks; it also works especially in the FOREX markets.
The amazing fact is this pattern works equally well in market declines, therefore I call it a Low Close Doji set-up. When I use pivot point analysis what I want to do is see how the market behaves at or near a pivot point target number. I also include a special moving average approach which is taught in my trading course that illustrates a conditional change in the market. Once we identify that the current market price is turning direction we can establish a trading position as prices close below a Doji low, a moving average cross over occurs and prices close below both moving average values. I use a combination of a specific moving average of the pivot point combined with a simple moving average. I stay with the initial position until those particular conditions change. In bearish conditions I look for a series of events such as lower lows, lower highs and lower closing lows to indicate a bearish trend. Once the market conditions change and we have a series of opposite events occur I stay on the short side of the market.
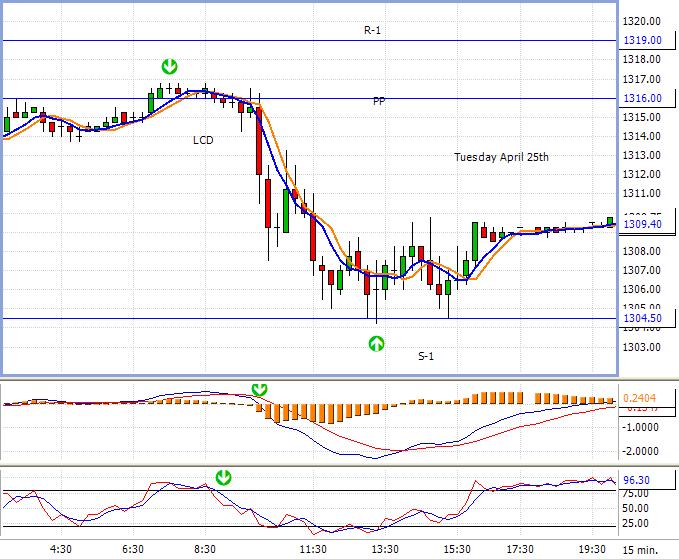
In the chart above we have a Low Close Doji sell signal triggered at the pivot Point, prices close below both moving average values and the moving averages cross signaling confirmation that a trend change has occurred. The profit target is the first Pivot Point support target level. If you notice that this method signals a short well before the MACD signal and even the Stochastics %K and %D 80% line cross method. As you will notice the low is formed by a doji candle. In the beginning of this article I stated the "Doji's form more often than not at Pivot Point Support and resistance levels". Here is another case in point. With that said, now you see why I focus on these high frequently re-occurring patterns and teach these specific patterns in my trading course.
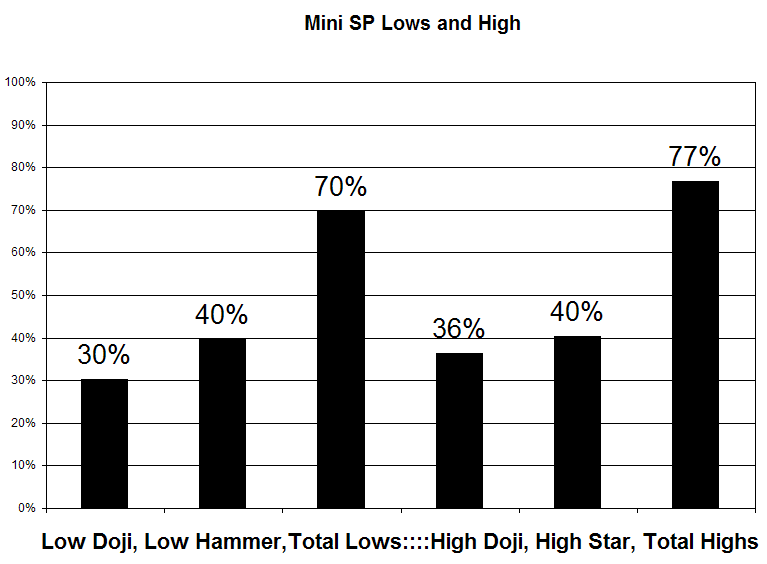
I went and took this observation one more step in my soon to be release book which is slated for sale in October 2006. I cover more on statistical occurrences when Doji's, Stars and Hammers form in certain markets. Here is an example of the frequency of these patterns, which was independently back tested by Genesis Software. In the example below using the e-mini S&P 500 futures contract, the test results were based on the US open out cry session using a fifteen minute time period. We ran these statistics on many markets; the best part is some markets had even better results than what I am sharing with you now. Looking at this bar chart below we see that 30% of the lows are established by a doji while 40% of the lows are made by Hammer formations. Combined that accounts for a 70% chance that the low is made by a Doji or Hammer based on a 15 minute time interval. At tops 36% of the time they are made by Doji's and 40% are made by shooting stars, combined it accounts for a whopping 77% statistic.
The methods introduced here are used to help keep the traders focused on the now, which means to watch and study the current price action. The Candle patterns give a visual confirmation on price momentum, and the Pivot Points forewarn you what the potential turning points are. When you combine the two methods you have a solid trading program.
There are many trading methods one can employ to actively trade including various mechanical trading systems and manual trading tactics. The constant changing of market conditions can require system traders to adapt and update the parameters for the trading decisions. I often prefer the hands on visual approach which is more of a manual method while employing mechanical risk management techniques. The visual approach is aided by the use of candle charts. The draw back is one must have a basic understanding of this form of charting to begin with. The upside is once you learn the basics, a new meaning of how markets act may open up to you.
It amazes me that candle charting was one of the first forms of tracking commodity prices some 400 years ago, today it has become more popular, however, relatively few Futures traders implement it in their analysis. The myth surrounding this method is that it is a highly complicated means of charting. The fact is it is a relatively simple method and enhances the visual effects in charting. Candle Stick Charting is a basic building block method that immediately shows a trader the important connection between the four most important aspects of price analysis. That is the relationship between the Open, High, Low and close of a given session. It involves colors to differentiate the relationship between the open and close referred to as the real body, it acts as an immediate way to illustrate and help identify the current markets environment and the current time frames acceptance or rejection of a specific support or resistance level in a clear visual manner. If for example, on a given trading session prices move higher from the opening price, and close near the highs, it shows strong buying interest. If after the open the market trades up establishing the high and then fails, the distance formed from those points of interest is called the shadow, which clearly shows rejection from that high price level.
There is one more formation, called a Doji where there is no main real body formation as the market closes at nearly the exact level from where it opened. That is the focus of this article.
In my Book "Technical Trading Tactics: How to Profit using Pivot Points, Candlesticks and other Indicators" I demonstrate many powerful ways to anticipate support and resistance levels. The most reliable and common method used to determine those levels is the mathematical based calculations from Pivot Point Analysis. Through the years I have noticed that Doji formations form more often than not at these pre-defined levels. That is the focus we want to concentrate on. The markets behavior at support and resistance levels especially when Dojis appear. The key is watching for confirmation for a transition to take place and to act when there is a shift in momentum. We see a specific conditional change take place in the markets behavior, namely the market makes a higher high but establishes a higher closing high above a Dojis high at the Pivot Point support level.
In this article I want to share with you in detail this one specific trade setup and what it takes to confirm the buy signal or what's known as a trigger to execute a trade.
This is the pattern I call the High Close Doji or the HCD method. It has dimensions of specific criteria that need to fall in place, therefore helping to eliminate and filter out false signals. It is a simple and basic approach that is a high probability winning strategy.
This setup may help you improve your trading performance and allow you to develop a consistent winning trading strategy. Consider this your own personal trading system that is based off of proven and powerful techniques. For a moment I want you to envision the concept of epoxy glue, it requires two compounds. Separately they are not very reliable or in fact a very strong bonding substance. However, when combined, a chemical reaction occurs and forms an amazingly strong and powerful bond.
Using the methods of Candlesticks with Pivot Points can give you that same result if you know what to look for. The implementation of longer term analysis using Pivot Points will give a trader a fantastic means in which to anticipate a point from where a trend change could occur, thus helping one to not only prepare but to act on a trade opportunity.
The setup:
One can implement this set-up using different time frames besides daily analysis. You can include weekly and even monthly Pivot Point calculations. Take for instance the Weekly numbers. They are compiled from the previous weeks High, Low and Close. This method of analysis after calculating the numbers will alert you well in advance of a potential Support and or Resistance level. If you have your calculations figured out on the close of business on a Friday then you are prepared before the weekend starts and now have a general guide of what may be the next weeks potential High, Low or both.
In the setup process you heighten your awareness to enter in a long or short position against predefined levels and wait for the trigger or market signal at those levels.
It can not only help you define or identify the target area to enter but also what you wish to establish as your risk objective. Another event that occurs with this setup process is you now can "set up" your orders to buy on your trading platform with the selected contract amounts. In other words, prearrange the commands on the electronic order ticket. Now all we need is confirmation so you can pull the trigger or click the mouse to establish an entry in the market and establish a position.
The chart below magnifies what you are looking for, notice once the market closes above the Doji's high we see an immediate reaction of positive momentum and a continuation of higher prices.
That is what we are focusing on especially after a decline in price and when the market approaches a predetermined support level based off of the Pivot Point Calculations.
Trading Rules for the HCD setup:
- When the market approaches a key Pivot Point, buy on the close or on the next open once a new closing high is made above the previous bullish reversal candle pattern especially a Doji formation.
- Place your initial risk management stop below the low of the lowest low point of the bullish candle pattern. This can be on a Manual Stop Close Only basis.
- Exit the trade on the close or the first open of a candle that makes a lower closing low after a prolonged uptrend.
- One can use a "Filter" or back-up process to confirm the buy signal against a major Pivot Point number such as a bullish convergence stochastic pattern.
A bullish Candle pattern can be a Harami, Harami Doji Cross, Bullish Piercing Pattern, A Bullish Engulfing Pattern or my favorite, but in most cases we want to act on a High Close Doji pattern. This pattern works for most markets including Stocks, Forex and Futures. This is a high probability intraday trading pattern however it works very well for position trading. There is a higher frequency of patterns that develop for intraday trading.
This pattern develops on various time periods, however I do not use less than a 5 minute time period. My favorite day trading time frame is using both the 5 and the 15 minute period. This helps me to catch trend runs as they occur in the market.
The example below is the CBOT electronic Gold contract taken from September 28th 2005. The first dimension we need is the Pivot Point calculations. So we take the prior days High, Low and Close and applying the formula we derive at 466.50 as the first Support level known as S-1. Notice the price action at the support level. The Doji Forms at the S-1 and two times periods later, an engulfing green candle forms, which signifies the market closed above the open. Notice that it also closes above the Doji's high.
I want to illustrate the flow of the market price action, notice we never see, until the end of the trading session, prices make a lower closing low. The sequence of events that transpire is higher highs, higher lows, and higher closing highs as defined by green candles, all the way up just past the daily projected pivot Point R-1 of 472.50. This is a great example of a HCD trigger that results in a 6.00 dollar gain in Gold.
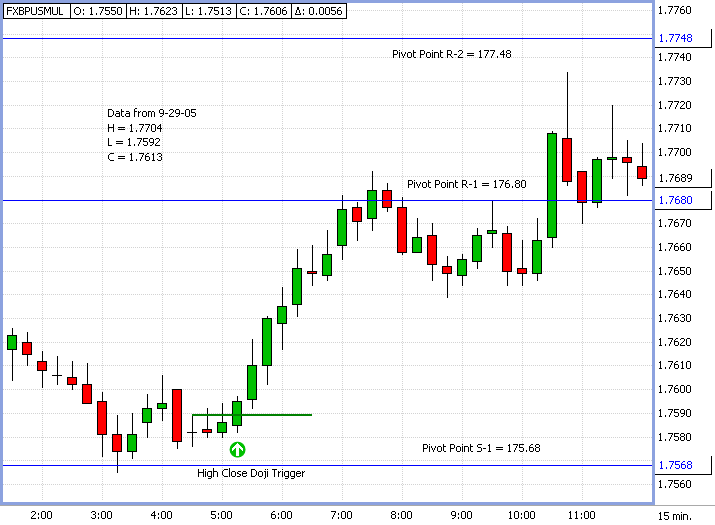
In case you were wondering if this set-up can be applied to Forex markets the answer is yes. This next chart is a spot FX British Pound from September 30th. If you apply the Pivot calculations derived from the prior days data you will have a predetermined support of 1.7568. Notice how the market bounces around and then the Doji forms. The trigger to buy initiates once the Green candle closes above the Doji high and the same sequence of events takes place, higher highs, higher lows and a continuation of higher closing highs all the way up until we hit resistance at the R-1 of 1.7680. That equates to nearly an 80 PIP or point gain.
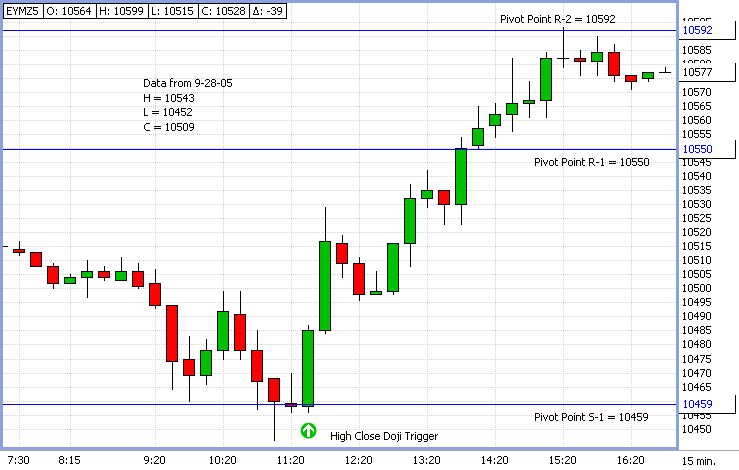
This next example is the CBOT Mini-Dow contract, in this example notice how the Doji forms right on the Pivot Point Support Line. Remember that Dojis form more often than not at Pivot Point Support or Resistance levels. Here the candle right after the Doji not only closes above the doji's high but see how it entirely engulfs the real bodies of the prior two candles of the Doji as well. That helps signal the power behind the reversal formation. As you can see we have a great run in the market testing beyond the R-2 number thus giving nearly a 100 point gain for the trading session.
This is a pattern that should show an imediate positive change as the reversal takes hold. Also notice that we see more green candles develop, which reflects the market closing above the open, thus confirming buyers dominating the market with better bullish momentum.
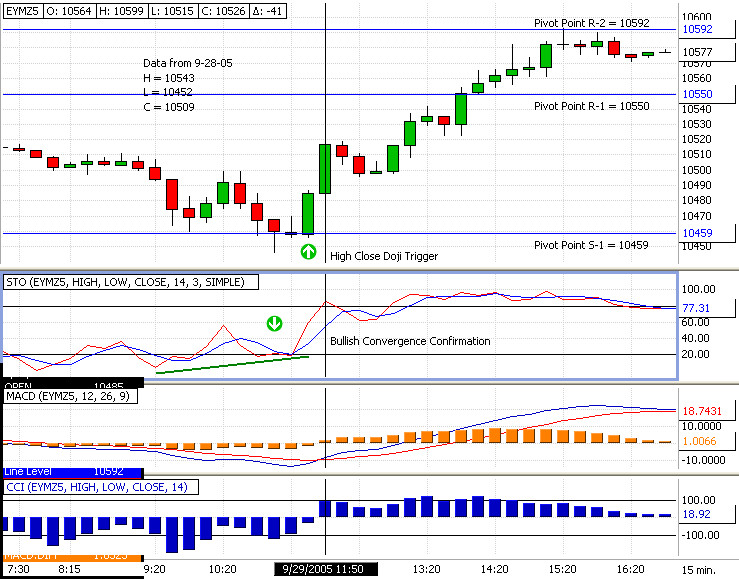
The rules also state that we can use confirming indicators. In the chart below we have three indicators, my favorite being Fast Stochastics, then MACD and CCI. As you can see Stochastics indicates a bullish convergence signal, validating that prices were near an exhaustion phase and ready to reverse, as the Doji formed.
The HCD trigger would have you long at the close or the open of the next candle near 10485. However, notice the MACD triggers late and would initiate a position near 10520.
The trigger in the MACD would be verified from the moving average crossover as well as the zero line crossover method. Notice how MACD does not form a Bullish Convergence either.
The CCI indicator is a 14 period setting. The Histogram feature does alert to a timely Bullish Convergence confirmation, but notice when we line up the zero crossover feature it also would trigger a buy at a much higher price entry similar to the MACD signal. One of the neat features of CCI is that it incorporates the Pivot Point formula in its calculation; it has great validity as a confirming indicator. It is non the less a lagging indicator and as the chart below shows signals an entry later than the HCD trigger pattern.
No matter which indicator you are comfortable in using, when investors first discover </span />Pivot Points, most often their first impression is one of pure amazement. Mainly due to its ability to predict what a specific time frames overhead resistance or support might be. Moreover, more times than not the High, Low or even both are right on target as the exact number for that given session. Make no mistake Pivot Point analysis is impressive. However, its real power and value does not end there. Pivot Point Analysis deals with pin pointing not only price but in a specific time period.
It is what I consider the "Right Side" of the chart indicator. It also gives you a method for identifying the trend and how to determine the typical price or fair value of a given time frame. After all, that is what the actual Pivot Point number is. If prices deviate too far from that point the outer calculation numbers can help you determine at what point a market is most likely to turn. One can also use this feature of the actual Pivot Point to develop a moving average system. But when traders combine these calculations with the visual aid of certain candle patterns, it can give you superior guidance as to when and where to enter and exit positions. Traders who want every edge in their approach for the highest probability of success will benefit from this simple but yet time tested method.
This is just one of the strategies that I wrote about in my book, A Complete Guide to Technical Trading Tactics. Remember this technique works amazingly well for futures, commodities and stocks; it also works especially in the FOREX markets.
The amazing fact is this pattern works equally well in market declines, therefore I call it a Low Close Doji set-up. When I use pivot point analysis what I want to do is see how the market behaves at or near a pivot point target number. I also include a special moving average approach which is taught in my trading course that illustrates a conditional change in the market. Once we identify that the current market price is turning direction we can establish a trading position as prices close below a Doji low, a moving average cross over occurs and prices close below both moving average values. I use a combination of a specific moving average of the pivot point combined with a simple moving average. I stay with the initial position until those particular conditions change. In bearish conditions I look for a series of events such as lower lows, lower highs and lower closing lows to indicate a bearish trend. Once the market conditions change and we have a series of opposite events occur I stay on the short side of the market.
In the chart above we have a Low Close Doji sell signal triggered at the pivot Point, prices close below both moving average values and the moving averages cross signaling confirmation that a trend change has occurred. The profit target is the first Pivot Point support target level. If you notice that this method signals a short well before the MACD signal and even the Stochastics %K and %D 80% line cross method. As you will notice the low is formed by a doji candle. In the beginning of this article I stated the "Doji's form more often than not at Pivot Point Support and resistance levels". Here is another case in point. With that said, now you see why I focus on these high frequently re-occurring patterns and teach these specific patterns in my trading course.
I went and took this observation one more step in my soon to be release book which is slated for sale in October 2006. I cover more on statistical occurrences when Doji's, Stars and Hammers form in certain markets. Here is an example of the frequency of these patterns, which was independently back tested by Genesis Software. In the example below using the e-mini S&P 500 futures contract, the test results were based on the US open out cry session using a fifteen minute time period. We ran these statistics on many markets; the best part is some markets had even better results than what I am sharing with you now. Looking at this bar chart below we see that 30% of the lows are established by a doji while 40% of the lows are made by Hammer formations. Combined that accounts for a 70% chance that the low is made by a Doji or Hammer based on a 15 minute time interval. At tops 36% of the time they are made by Doji's and 40% are made by shooting stars, combined it accounts for a whopping 77% statistic.
The methods introduced here are used to help keep the traders focused on the now, which means to watch and study the current price action. The Candle patterns give a visual confirmation on price momentum, and the Pivot Points forewarn you what the potential turning points are. When you combine the two methods you have a solid trading program.
Last edited by a moderator: