You are using an out of date browser. It may not display this or other websites correctly.
You should upgrade or use an alternative browser.
You should upgrade or use an alternative browser.
Hello Lúidín,
Okay, I still don't get the strategy here. My initial thought was that we use the 30m chart to establish a trend bias. In your example with the SPY, it is down, so we look for just shorts. We also mark out the H/L of the bar before the current bar. We then drop down to the 5m to look for the break of the low, then the 5sec, though not sure the part this plays. However, I am inclined to discard this thought because if that was what we are looking for - a break of the low of the previous 30m bar to enter, then why the need for the 5m and 5s charts, why not just place a sell stop at the low of the previous 30m bar on the 30m chart?
Unless what we are looking for is a pull back, and this is probably why the 5s chart is part of the equation. So we look for the break on the 5m chart, then drop to the 5s to wait for a pull back (not pulled back all the way into the H/L range) and then enter short below the pull back, supported with the NYSE tick below 0 (probably the more below 0 the better). Is that it? Also with regards to the stop, will this be the high of the H/L range, which if it is the case, then we can not have fixed number of shares like 100 as the number of shares will be determined by how wide the stop is to maintain our maximum stop loss of $100. Currently slightly confused.
Lúidín
Established member
- Messages
- 818
- Likes
- 61
It will all depend on how much you want to try make. If you use the 30 min bar as trend, and want to trade that trend, then you can short when low of previous bar is taken out, or if price is near high of previous bar but has come back a bit.
You will have to start and see what happens, as you will not know where price will be until you sit down after work.
The problem will be time of day, as if the last 3 bars are down, then the next could go up, so the 5 min trend will also be important.
The 5 sec is the least important in relation to trend, but if the Tick is at extreme, then you need to be careful if trading in same direction, or, if Tick is at +800 you need to be wary of going long, unless all the trends are up and high volume.
For now I would not worry too much, main thing is to start, and you can start with short below previous 30 min low, long above previous 30 min high.
Stop can be put at % of previous bar if previous bar range is too wide. Once you start you will start to look at the 5 min and 5 sec, and get a feeling for how all 3 relate, but it takes time, you can not expect to see what has taken others years of looking to see. This is how it is, and this is why very few can replicate what others show them, as to do what others do, you need to think and act the same, which is next to impossible to do. This is also the reason why you should never pay anyone money for them to show you what they know, for the chances of you achieving the same results are very slim.
Do not be concerned, just get going.
Lúidín
Hi Lúidín,
So it does not matter the direction of the 30m chart then?
So the 5 sec chart is to see what the Tick is doing?
So if I may surmise from my understanding:
1) Mark out the H/L of the penultimate bar on the 30m chart.
2) Watch for the break of the high or low on the 5m chart.
3) If either the high or low is broken, look at the 5s chart with regards to the value of the Tick for additional evidence to take the trade or not.
4) Stop will always be no more than our maximum permissible loss. If this happens to be on the other side of the high/low range, fine, else some where in between.
Correct?
..then you can short when low of previous bar is taken out, or if price is near high of previous bar but has come back a bit.
So it does not matter the direction of the 30m chart then?
The 5 sec is the least important in relation to trend, but if the Tick is at extreme, then you need to be careful if trading in same direction, or, if Tick is at +800 you need to be wary of going long, unless all the trends are up and high volume.
So the 5 sec chart is to see what the Tick is doing?
So if I may surmise from my understanding:
1) Mark out the H/L of the penultimate bar on the 30m chart.
2) Watch for the break of the high or low on the 5m chart.
3) If either the high or low is broken, look at the 5s chart with regards to the value of the Tick for additional evidence to take the trade or not.
4) Stop will always be no more than our maximum permissible loss. If this happens to be on the other side of the high/low range, fine, else some where in between.
Correct?
Lúidín
Established member
- Messages
- 818
- Likes
- 61
Ok then, try this on your charts and post it to see what it shows.
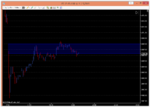
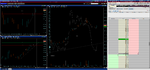
Mark the H/L for 30 min bar 14:00 to 14:30
Mark the current H/L on the 5 min for 14:35
Mark the current H/L on 5 sec for 14:35
I am redoing my laptop OS, so will be on and off with spare laptop.
Mark the H/L for 30 min bar 14:00 to 14:30
Mark the current H/L on the 5 min for 14:35
Mark the current H/L on 5 sec for 14:35
I am redoing my laptop OS, so will be on and off with spare laptop.
Image attached.
By the way, do you know an easy way to jump to a particular bar in time (i.e. you want to jump to the 14:35 bar of 13/11/15 on the 5 sec chart). Also. an easier way to attach the horizontal lines to a particular price (i.e. want to draw an horizontal line on 204.35) instead of having to manually move it up and down until you manage to align it with the price you want (not always easy).
One other question, what of when there is a gap (between the penultimate and current 30m bars)? Thanks
Attachments
Last edited:
Lúidín
Established member
- Messages
- 818
- Likes
- 61
IB have a brilliant platform, but their charts are crap when it comes to drawing lines and boxes. I have sent in numerous requests but you are just wasting your time, as retail traders are like drops in the ocean to them.Ninjatrader is much better, or even Multicharts, but I am used to IB now so I don't really bother with others that much. If you want to get some real practice offline, then download Ninjatrader, link it to IB data feed, and use the playback feature to play the market back to whatever time you want, as far as I know you can even place trades on the playback, but you will have to test that yourself.
You do not want to draw too many lines on 1 chart as it will make the chart messy. If you have 2 or 3 monitors, then best to put the individual charts up with no "share trend lines among charts", as you will be checking all three charts when trading and will know where your major S&R lines are.
It is always harder trading on laptop, or with just 1 monitor, but if that is what you have then you have to make use of it and trade whichever setup works best for you. I use laptop at the moment.
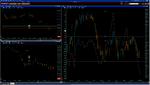
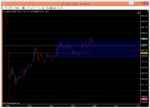
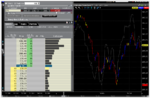
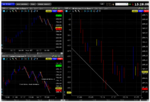
Back to 3 chart Spy.
Trend is down, clearly identified by the down line on 30 min and 5 min.
Low risk trade would be to short near high of down trendline. You must realise that the 30 min bar and 5 min bar would be blue on these charts if live, so looking back to try get exact detail is hard, hence use Ninjatrader if you want to do more of this, but practice live will be better of course.
The 5 sec is up, but the TICK has not followed thru and volume is reducing. Might be bad time to go long, and we are also in middle of 5 min range, which can be more risky trading than at range extremes, but, as the trend is down, we are primarily looking for shorts over longs, as long as the 30 min does not close above previous bars high.
There is a lot to it, and it is very hard to explain how you must react to price changes at certain levels, but the only way to learn is by experience, no short cuts unfortunately, even though most will have you believe so, especially if you are paying them some money.
To be honest, if you are trading full time, you need 3 to 4 monitors, as there are a few more things like Booktrader and Time & Sales that also provide clues as to when the market might be starting to reverse, but you can not just explain it to someone, you have to be in front of the 4 monitors, have them setup so that you can scan them correctly in the right order, and I do believe that your setup is as important as your risk control, even more so, as bad entries cost you money real quickly, and good entries make you money real quickly, which is what you need to perfect. The better you get at entries, the better you get at reducing your risk per trade.
Hope I am not putting you off 🙂
You do not want to draw too many lines on 1 chart as it will make the chart messy. If you have 2 or 3 monitors, then best to put the individual charts up with no "share trend lines among charts", as you will be checking all three charts when trading and will know where your major S&R lines are.
It is always harder trading on laptop, or with just 1 monitor, but if that is what you have then you have to make use of it and trade whichever setup works best for you. I use laptop at the moment.
Back to 3 chart Spy.
Trend is down, clearly identified by the down line on 30 min and 5 min.
Low risk trade would be to short near high of down trendline. You must realise that the 30 min bar and 5 min bar would be blue on these charts if live, so looking back to try get exact detail is hard, hence use Ninjatrader if you want to do more of this, but practice live will be better of course.
The 5 sec is up, but the TICK has not followed thru and volume is reducing. Might be bad time to go long, and we are also in middle of 5 min range, which can be more risky trading than at range extremes, but, as the trend is down, we are primarily looking for shorts over longs, as long as the 30 min does not close above previous bars high.
There is a lot to it, and it is very hard to explain how you must react to price changes at certain levels, but the only way to learn is by experience, no short cuts unfortunately, even though most will have you believe so, especially if you are paying them some money.
To be honest, if you are trading full time, you need 3 to 4 monitors, as there are a few more things like Booktrader and Time & Sales that also provide clues as to when the market might be starting to reverse, but you can not just explain it to someone, you have to be in front of the 4 monitors, have them setup so that you can scan them correctly in the right order, and I do believe that your setup is as important as your risk control, even more so, as bad entries cost you money real quickly, and good entries make you money real quickly, which is what you need to perfect. The better you get at entries, the better you get at reducing your risk per trade.
Hope I am not putting you off 🙂
Attachments
Last edited:
Lúidín
Established member
- Messages
- 818
- Likes
- 61
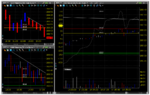
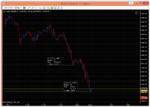
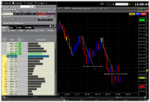
You have another option, in fact you have many options, but this is a simple one. It requires a bit wider stop, but that is fine once you keep the size small.
You can only use 2 lines, red and green, and move them as the swings develop. I would be very surprised, if you used this for a week, and you did not have a good deal of winning trades by the end of the week.
You can only use 2 lines, red and green, and move them as the swings develop. I would be very surprised, if you used this for a week, and you did not have a good deal of winning trades by the end of the week.
Attachments
Lúidín
Established member
- Messages
- 818
- Likes
- 61
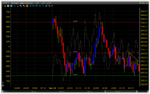
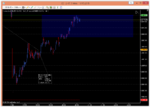
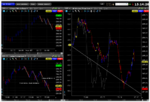
With Ninjatrader you can automatically add lines like this, but be careful, as it is easy get carried away and go off looking for loads on ninjascripts, and all you will do is waste time and effort.
Overall, the charts in Ninja are far superior to TWS charts, so once you don't want to trade directly from the charts, I would use Ninjatrader over TWS, as the chart is your main tool, and you should always use the best tool available to you, especially if it is free.
You can trade directly your IB account from Ninja charts with IB link, but you need to buy Ninja to trade live, or get it!
Attachments
Lúidín
Established member
- Messages
- 818
- Likes
- 61
As you progress, and get confidence with small size, you will then start to see that there is a lot more to it than you think. If you start to trade seriously, then you will need to get an understanding of measured moves, and how to look for them, and how not to look for them.
There is an awful lot to trading, as I keep saying, and the level you take it to will depend on the experiences and the results you achieve. the more money you make, the more you will want, but you need to be very careful, as if you get carried away, and think you know something that others don't, then you will more than likely regret it, and will kick yourself in the ass after losing all of your hard earned money back in a very short time by trading big size.
A fool will always give back what he wins, a clever person will take it out and put it aside, and keep on doing what he is doing. The day you think you know it all is the day you will start to give it all back.
Lúidín
Attachments

Last edited:
Lúidín, once again thanks a lot for all your assistance (I appreciate how much time and effort you are devoting towards this - writing, explaining, screen capturing charts and uploading etc). I am currently at work, but will go through what you have posted so far when I get back from work later this afternoon, and get ready for the 19.30 session.
Okay, haven't taken any trades yet today because I was a bit confused. I started at 19:30. 30min and 5min trend was up, so was looking for longs. However, where I got lost was at exactly what point to take the trade. Still not sure how to use the 5sec chart, and in conjunction with the TICK; it's just not clear to me and fast.
Also we were talking of starting with 100 shares for the SPY, however, looking at Book trader I can only see very small numbers (single and double digits) on the bid and ask size.
Also we were talking of starting with 100 shares for the SPY, however, looking at Book trader I can only see very small numbers (single and double digits) on the bid and ask size.
Attachments
Lúidín
Established member
- Messages
- 818
- Likes
- 61
Had to redo my laptop completely. Got rid of Win 8.1 and put on Win 7, and it appears to be faster.
You should have all the depths in booktrader.
Are you subscribed to market subscriptions for US Stocks Data Bundle?
Is your account funded yet with any money?
You should have all the depths in booktrader.
Are you subscribed to market subscriptions for US Stocks Data Bundle?
Is your account funded yet with any money?
Attachments
Lúidín
Established member
- Messages
- 818
- Likes
- 61
You should not worry about the nitty gritty right now, as it is best to start trading and see how it goes.
If you just take the 30 min trend as mentioned, with the last bar as the key S&R levels, then just start with that. You will quickly see how price can move quickly around your S&R level once you execute, but that is normal, so you will then start to look at 5 min to see what you done wrong, and where would have been a better price to enter.
You will not get it all right for a good while, how could you, as you have not being doing it.
Lúidín
Established member
- Messages
- 818
- Likes
- 61
You can look, and trade, many ways. What you need to do is start, as it is the only way to find out how you will react to price movement. Paper trading is only useful if you take it very serious, which is hard if you have no money at risk, so once you get to grips with software and order execution, I would start real small, even 50 shares at first is that makes you feel better.
You will quickly realize what it takes to make money, and if you post 10 trades it will be easy to see what your problems are, which you might not even notice yourself.
8:06 pm
You will quickly realize what it takes to make money, and if you post 10 trades it will be easy to see what your problems are, which you might not even notice yourself.
8:06 pm
Attachments
Lúidín
Established member
- Messages
- 818
- Likes
- 61
BTW, do not think when you see something repeating that you have it cracked, far from it, but certain things do repeat more often than others, and enough times to put the odds in your favor. If you start thinking you will get the same results every time, then you are just fooling yourself, and it will only be a matter of time before you lose big.
Win 7 is much better, sorry I did not change it before this.
Win 7 is much better, sorry I did not change it before this.
Attachments
Lúidín
Established member
- Messages
- 818
- Likes
- 61
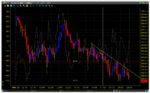
Also, if you find the 5 sec too fast, then use the 1 min, and you can hide the TICK, just use the left hand axis to check the TICK price level before you execute, as you want to be careful when TICK is at extremes, as mentioned previously.
There are no right or wrong ways to trade, some will find certain ways better then others, it really is a personal choice and you are always better to trade with the way you can relate to best, and if it does not work out fairly quickly, say after 20-30 trades, then you know you need to rethink what you are doing and change something. You are not going to be different than anyone else, as your biggest problem, even though you don't know it at this moment, is the way you think.
We are currently still in a downtrend on the 30!
If you hide the TICK on chart, then you can turn off autoscale, set scale type to "None" in the secondary series.
Attachments
Last edited:
Similar threads
- Replies
- 0
- Views
- 2K
- Replies
- 23
- Views
- 13K