'The Expert', what exactly was he on about?

You are no different to most, including myself, as very few bypass the silly stage.

I will keep the posts as short as possible, and will not post any rubbish or time wasting information.

We will start as if you are not trading any market, and see what happens.

1. How much trading capital do you have available to put into a trading account.

Can come up with the equivalent if $50k, if I have enough faith in my methods and money management so as to lose everything.

2. What time, or times, do you have available to you during the day.

I reside in the UK and work a pattern of early shifts and late shifts. So when I am on early shift, I can't trade until back from work late afternoon, hence reason I was looking at the US stocks and ES for this period. When I am late shift, I can only trade in the morning before leaving for work, hence FX during this period.

3. How old are you.

Late forties.

Lúidín

Thanks.
 
It is good you are over 40, as most don't cop on until then.

Do not use capital that you do not feel comfortable with. $30K should be fine to start with, and goal is not to lose more than $2k before you start making some money every week. You will be limited to what stocks you can trade, but for now that will not matter.

You should not pick your market based on your available time, but it will determine what type of trading you should do.

I would suggest the following for you to consider.

1. Pick just one market for now - daytrading US stocks.

2. If you are unable to trade at the open, 14:30 to 15:00/15:30 UK time, then you do some trades for the closing 1.5 hours, 19:30 to 21:00.

3. Open a margin account with $30K - buying power $120K - decent broker like IB who offer cheap commissions for trades up to 1,000 shares, which is more than adequate for retail investor.

4. Max risk per trade $100 - equal to approx 0.33% of your $30K

If you can see the benefit of this, then you can get setup and get ready to start trading after a few days getting used to the TWS software, which is easy enough if you have not used it before.

Again, all above is assuming you already know a bit about trading, as the next steps will be all about picking the least risky stock to trade, knowing the max loss level, the stop level,the profit target level, and best time to trade.

After that it is all systems go, win or lose, no IF's, no BUT's or no MAYBE's.

As mentioned, the goal is to not lose more than $2k before making some money every week becomes a reality.

Do you think you are ready to commit to something like this?

Lúidín

Definitely, with the following caveats:

1) I will initially start with paper trading (and try and make it as realistic as possible, I know it is not the same thing as live trading, but I need to be competent and comfortable with every aspect of the trading - method, platform, money management and psychology) until I have more faith in whatever method/strategy I embark on before committing real money.
2) I will not be able to trade everyday due to work commitments, as already explained.

Many thanks for your assistance.
 
Last edited:
If you feel like paper trading that is fine, as you already know it is not the same as live trading, but can of course greatly help once takes it seriously and trade the same as if it was live.

In that case, all you need do now is open an account with IB, as I think they now give access to delayed data for new unfunded accounts, which you can check easily.

Not trading everyday has it's advantages, so I would not worry about that.

Watching the close here to see if the SPY pushes lower, hard to say at the moment as the options data is not clear cut, as it warrants a small rally but hard to see it happening today?

Lúidín

Hi Lúidín, I already have a funded IB account, and also have a paper account attached to it which I use for demo. It's currently 20.45 here in the UK, and unfortunately I am about to pop out (work related), so I won't be able to watch what you are currently watching. I can still post, but just won't have access to trading platform/data feed.
 
Hi Lúidín, I already have a funded IB account, and also have a paper account attached to it which I use for demo. It's currently 20.45 here in the UK, and unfortunately I am about to pop out (work related), so I won't be able to watch what you are currently watching. I can still post, but just won't have access to trading platform/data feed.

You are fine, speak whenever, no hurry.

Lúidín
 
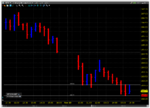
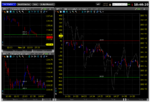
One chart for SPY.
 

Attachments

  • Screen Shot 11-13-15 at 03.56 PM.PNG
    Screen Shot 11-13-15 at 03.56 PM.PNG
    58 KB · Views: 223
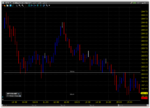
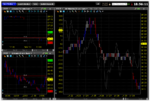
Second chart for SPY
 

Attachments

  • Screen Shot 11-13-15 at 04.06 PM.PNG
    Screen Shot 11-13-15 at 04.06 PM.PNG
    70.4 KB · Views: 201
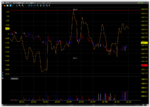
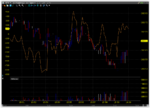
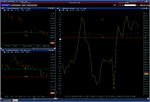
Third chart for SPY.
Vertical buffer adjusted to show red and green lines.
2nd screen shot with no buffer adjust, much better view, so best to have this one on a single screen if possible, but not required unless doing some serious trading where you are taking on big risk.
 

Attachments

  • Screen Shot 11-13-15 at 04.19 PM.PNG
    Screen Shot 11-13-15 at 04.19 PM.PNG
    89.7 KB · Views: 229
  • Screen Shot 11-13-15 at 04.29 PM.PNG
    Screen Shot 11-13-15 at 04.29 PM.PNG
    90.7 KB · Views: 209
Last edited:
You are looking at the exact same thing as everyone else, with the only thing that might be slightly different is third chart, as most will use the 1 min, which is also fine if that is what works best for you.

The only difference now, between you and everyone else, is how you interpret what you are looking at, and how you act and react when price changes on the chart.

If you act stupidly without thinking, you will lose, that is a guarantee.

If you act intelligently, think about what you are doing, and know that no matter how good you get at interpreting price movement you can still be wrong, then, you will have a very good chance of making more money than you lose, which is what trading is all about.

Lúidín
 
This is where the fun starts. You now have 2 options, take it seriously or mess around.If you take it seriously then you will have to do some work, which most do not commit to, for whatever reason.

You must now say how much is in your account so that you can decide on what stock, or etf, to trade. If your balance is low, or if you have a cash account, then you have another option available to you.

From here on you will have to give details of your trades, paper or real, and show the chart for each trade. It is not necessary to write down the details for every trade you make, as some might be very fast and you will not have time to think too much, as opportunities have to be acted on as soon as they arise.

I have cut out all the usual crap, it is now up to you if you want to proceed or not. I may, or may not, post additional charts, it will all depend on what you do from this point forward. You will not learn anything of value by asking others, unless you start to do something, for, there are far too many experts in this game, who are really nothing more than Walter Mittys.

Lúidín
 
Okay, I presume you are using the SPDR S&P 500 ETF - ARCA stock (SMART) on IB).

Questions

1) You have used very specific time frames - 2 day/30min time frame, Today/5min, and 10minutes/5sec. What is the significance of this if any?
2) In the first chart, the 203.04 line, I am not sure whether you are marking out the high of the current bar or previous bar, as the previous bar high is actually 203.05 and the current bar's is 203.01, as per my chart.
3) The brown squiggle line on the last two charts, what is that?

Obviously you have not explained/outlined the method here, but if I take a stab in the dark, we mark out the H/L of the previous bar on the 2 day/30min, give us a range., and then zoom down to the Today/5min, though not too sure of the part this plays here, and then down to the 10min/5 sec. However, what are we looking for? How are we using the SPY chart to trade the selected stocks? How....

We have a volume spike at 16.00 with a bearish outside bar, but this (volume spike) is normal anyway towards the close of the market. So not really sure what to interpret here?
 
Hi Lúidín,

You must now say how much is in your account so that you can decide on what stock, or etf, to trade.

As I am going to start with paper trading like I already mentioned, I will go with a hypothetical figure of $30k, which will be the amount I will deposit in my account when I eventually go live.
 
This setup is for trading the SPY, as what you trade will be determined by how much buying power you have. If you do not have enough for say 200 - 500 shares, then the other option is to trade current week atm options with the best available spreads, but you will have delta issue, which is fine once you know that you will not lose or make as much as outright shares.

Your setup will depend on what time of day you trade, different setup for trading the open compared to trading the last 1.5 hours, which is what I suggested with these 3 charts.

1. Yes, 30 min is your trend, 5 min is your signal, and 5 sec is your timing. If you trade silly nilly then you will get silly nilly results.

2. The lines are high and low of last 30 min bar, they should be the same but it is not unusual to see a few cents diff as I have seen this before, it really does not matter if it is only a few cents.

3. That brown squiggly line is NYSE Tick.

You will have to start thinking, as you have the current trend H/L, you have the 5 min to signal continuation or reversal, and you have the 5 sec for timing your entries and exits.

Volume is used for confirmation, basic stuff, price rising on low volume is not strong buying, vice versa, but you do not trade based on volume, you trade based on price, as volume can be very misleading, especially with HFT trading kicking in and out.

You must trade what you are comfortable with, if you want to pick a stock pick one, and you can explain why you think it is worthwhile trading.

Lúidín
 
Okay, next week I am early shift, so I will be available to trade the 19:30 - 21:00 gmt session. Never looked into EFTs before, so I hope my calculations below are correct following your money management suggestions. Current price is approximately the $200 mark, I should be able to trade about 500 shares giving a purchase price of $100k, and margin requirement of $25k (using IB's 1:4 for margin for day-trades). However, as I want to treat this as realistic as possible and to be on the safe side of a margin call, I will go with a max of 400 shares (so my marging requirement will be $20k, so got a $10k cushion left of the $30k starting capital).

Now going back to the charts and scrolling back to begining of the session at 19.30 gmt of 13/11/15

First chart is the 2 day/30min. I have marked out the H/L of the last 30m bar before the vertical line I drew (just before the 19:30 bar). The trend at this time is down. So are we looking for shorts only.

Second chart is the Today/5min. So are we looking for a break of the low (red line), which occurred at 19:40?

Third chart is the 10min/5ec. So what I will looking for to enter the short? Also, just to clarify, if I had entered at 203.01, my stop would have been 203.25 (max loss of $97.50 ($100 - $2.50, working on a round trade commission of $2.50)


Now what is the purpose of the NYSE tick and how does it assist here with our trading decision? Also, how do you get it on to the chart (i.e. where do I find in Chart settings)?
 

Attachments

  • SPY 194130_131115.png
    SPY 194130_131115.png
    48.5 KB · Views: 178
  • SPY Today5min_131115.png
    SPY Today5min_131115.png
    46.4 KB · Views: 146
  • SPY 2day30min_131115.png
    SPY 2day30min_131115.png
    52.5 KB · Views: 163
First, I suggest you do a few setup things.

1. Launch the Mosaic in TWS and set up a new tab, call it "SPY 3 Chart".

2. Set up your 3 charts. I suggest you change your colours as the charts you have looks very dull, and you want to bars to stand out so that you can see them easily. You can add the NYSE Tick to the 5 sec chart by clicking on Edit > Secondary Series, and adding it there. Make sure you select "secondary axis" as you want the scale on the left. You can also select "auto scale" for now.

3. You start with 100 shares, as this is what you must do when starting live.

I have setup the charts below just like I said, and zoomed in to your start time.

Here you can see what you would have been presented with.

You know where you are, you now need to wait for a signal on the 5 min and then confirm that the timing is correct as possible by using the 5 sec. I say correct as possible, as there will be times when price will suddenly reverse on you after entry for no apparent reason, and that is why you have to know where to get out if it goes against you, and where to get back in, as you must keep trading after a loss, otherwise you will be just wasting your time.

Before you decide on SPY, you can look at a few stocks that move slower, as SPY is prone to sudden fast moves due to HFT and Pro's trading it. I would not recommend trading SPY to those who do not have good experience trading fast markets.

4. On any chart, go Edit > Global Chart Configuration, scroll down to "Trend Lines" and tick the box for "Share trend lines among charts" and click "apply".
 

Attachments

  • Screen Shot 11-14-15 at 06.48 PM.PNG
    Screen Shot 11-14-15 at 06.48 PM.PNG
    104.8 KB · Views: 151
Last edited:
Here is the other choice, as in slower movement/smaller ranges. You can pick something like this if you want, and 200 shares can be traded as it does not move as fast, but no more than that staring off as you have to get used to the stock you are trading.

You can pick any stock you want, but you must explain why you are picking it.

https://finance.yahoo.com/q/cp?s=^DJI+Components


The New York Stock Exchange (NYSE) Tick is a measure of how many stocks are rising in price versus how many are declining in price. An upticking stock is one where the most recent change in price was positive; a downticking stock is one where the most recent change was negative. Tick is calculated by subtracting the number of downticking stocks from the number of upticking stocks. For example, a tick reading of +350 means there are 350 more upticking stocks than downticking stocks.

Tick is recalculated continuously throughout the day. Normal tick levels are between +500 and -500; tick readings of plus or minus 1000 are generally considered extreme. Daytraders often use extreme tick readings to determine short term overbought and oversold conditions.
 

Attachments

  • Screen Shot 11-14-15 at 06.56 PM.PNG
    Screen Shot 11-14-15 at 06.56 PM.PNG
    112.8 KB · Views: 143
Last edited:
One of the biggest problems you will face, is that there is way too much information available to look at, and the more information you add to your setup the slower you will be at making decisions.

3 charts are plenty. You can change the 30 min, in fact you can have any 3 combinations you want, as long as you can use the information provided to make good decisions, which is easy to know by the win/loss ratio you will achieve.

I personally would not add any other broad market indicators, as NYSE Tick I believe is adequate.

Once you have your setup done, you can start to look for entries based on the 3 charts.

Exit will be determined by the charts also, as your max risk is your hard stop in the market, but you want to get out before this if the charts tell you to, do not think that you are going to risk $100 on every trade, as you will not, for when you start trading bigger size you must have perfected tight stops, otherwise making money will be very hard, especially if trading fast moving markets.

It is not easy, but making money never is.

Profit taking is also chart dependant, and is harder to perfect than loss taking, as one tends to feel like taking a profit early, which is fine once you are ready to get back in, but if you sit back after making 15 or 20 cent, and do nothing, then market can move real fast and you will start chasing, which, is the start of giving money back, and the whole cycle repeats over and over.

Lúidín
 
What have you picked up from the 3 chart setup, and what do you need to do based on your objectives, as in, what portion of the range are you going to try for, for, if you want to make 50 cent or more, then you will probably have to change the 3 charts, and use wider stops.

Bigger profit targets require bigger stop levels initially.

More reward will always carry more risk.

The advantage of smaller profit target per trade, is that you can do much more trades with larger size, and thus over time, perfect the method so that you can make more money for less risk, which is what is called an "edge".

Lúidín
 
Quick reply before I retire to bed for the day. Firstly, thanks so much for devoting your time and efforts towards this. I very much appreciate it.

i have attached a pic of my chart set-up following your cue. For the third chart, I could not get 200 seconds for some reason, so I used 3 minutes, so it shows 3 minutes/5sec, as opposed to your 200 seconds/5sec. Also the chart does look quite different from yours. I used the symbol "TICK-NYSE" for the NYSE tick, is this correct?

You have not confirmed or refuted my partial explanation of what I think is the entry method. Basically what is the method for taking trades, what are we looking for? I still don't know the essence of the NYSE tick, and how we enter on the 5 sec chart. Are we looking for a pull back to the break of the high/low of the previous 30min bar? Or, is my presumed theory completely wrong?

Anyways, good night for now.
 

Attachments

  • SPY3 151115.png
    SPY3 151115.png
    132.7 KB · Views: 151
Top