The DOW this week 24/06 - 28/06

ChartMan

Legendary member
Messages
5,580
Likes
47
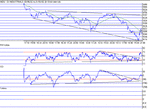
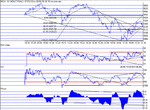
So. The long term DOW view and Friday's analysis proved worthwhile. Armed with that, the eventual lift off from 9100 should have been a great long entry, just as the downtrend continuation from the open was to be expected, to meet the prior bear flag target.Positive divergence over 55 minutes was the key to the long entry.The bottom finally provided a 3 slope change as well.Also from Friday, the brick wall resistance of 280 met with little opposition, initially, but finally saw it for what it was at the close. A brick wall. To go on from here, we need to establish 280 as support. Being the eternal optimist that I am, finding support at 280 should lead to substantially more upside. This will form and inverse head & shoulders with a target of 460 ish, where again we see more resistance.There is also the possibility of an expanding triangle coming into force....
100 MA: 9316. Support: 9281,9220,9132,9100. Resistance: 9281,9310,9332,9364,9432,9464...
 

Attachments

  • dow240602.gif
    dow240602.gif
    13.4 KB · Views: 587
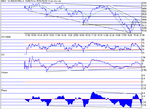
Well, we didn't find support at 280,and it fell as easily as it was broken on the way up. Things are now looking distinctly pear shaped. The "V" bottom has failed to deliver to the target, and so I have to conclude, as in 1 min charts, that a TA failure is indicative of a continued downtrend......There is no reason to think otherwise. If one looks at today's action ,broadly as a bear flag the we get the following:- peak 9716, low 9093 = 623. Drop down from today's break at 9370 and we get the target of 8747 The phase channel is now in a down trend and the price support line projects forwards to a support of 9000 ish. That or we bounce off 9100 to save the day.So critical support is 9100. RSI support gone, CCI still in uptrend support.
100 MA: 9300. Support 9110,9186,9000. Resistance: 9150,9200,9232,9250,9300.
 

Attachments

  • dow250602.gif
    dow250602.gif
    15.6 KB · Views: 559
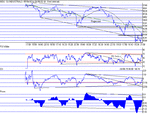
Phew! Almost meltdown thanks to WorldCom.Still after all of today's action things look distinctly better at the end of the day compared to the begining. The question is this. Had the WC situation not arisen, where would we be? Would we have been at 9300 or is this all part of the big picture? The recovery was nothing short of a miracle, especially considering we closed down on the day by only 5 points or so, and above 9100 resistance / support. The Phase channel has ended above the mid point and the price is below the 100MA and the regression line, suggesting some upside. Things are developing nicely, but we still need to confirm 9100 support level to move on up. A distinct RS switch may prove decisive.....
100MA: 9145. Support: 9100, 9088,9050,9000,8950. Resistance:9132, 9145,9180, 9200,9234,9274, 9300.
 

Attachments

  • dow260602.gif
    dow260602.gif
    15.7 KB · Views: 493
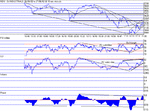
We got the upside move....and have now started to develop an up channel trend.Thing is, Phase has now moved from above the mid channel to the top of the channel - i.e. resistance. The top of the price channel projects beyond 360 ish, but we have to contend with 9300 resistance first. RSI and CCI have formed both confirmed RS switches, as suggested last night and bull triangle/wedges. Those triangles provide a target of 9500...entirely feasable if 300 can be broken. The downtrend resistance line was also broken late in the day with a significant retrace to bounce off it and become support.That makes downside support 165. On balance, it should be more upside with a good entry at the 300 break.
100MA: 9157: Support: 9232,9200,9164,9132. Resistance: 9300, 9332,9400,9470.
 

Attachments

  • dow270602.gif
    dow270602.gif
    14.2 KB · Views: 484
We made the suggested 360 and that was that. Phase has turned back from the top of the channel to the mid area. Fibonnaci retracement shows good correlation to price and is therefore "valid". The close sits exactly on 38% retrace....TA uptrends are broken suggesting that we may have come to the end of this upside....Key support levels are going to be the Fib. values, the lowest being 9125 @62%...If this were the 1 min chart, with the bull triangle failure on RSI , I would have to say there is more down side.....
Looks like a retrace to172 and then descision time again.....
100MA: 9241. Support: 9232,9183,9125. Resistance: 9241,9305,9360..
 

Attachments

  • dow280602.gif
    dow280602.gif
    17.7 KB · Views: 433
Top