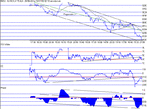
The DOW this week 15/07 19/07

ChartMan

Legendary member
Messages
5,580
Likes
47
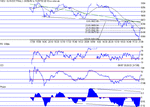
Just a quick report tonight. Looks like there is temporary relief today from the bottomless pit. Having dropped 400, the last hour and a half recovered almost all of that. Interpolating phase, it seems it eneded above the 50% line and thus maybe there is some upside around the corner.Fibs closed Just above the 38% and I see 8600 as pivotal tomorrow.
 

Attachments

  • dow150702.gif
    dow150702.gif
    14 KB · Views: 557
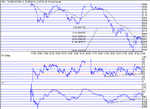
A vicious hammer on the daily and a potential island reversal on the 15 min chart if it gaps up tomorrow, normally would suggest more upside..then again no point in calling this market after seeing the mother of tanks followed by the father of bounces in a flash, trying to catch moves intraday makes more sense to me...

Riz
 
So,we never broke out from 8600. We haven't lost the 62% either, but just hanging on by a thread. Divergence on RSI and CCI should come into effect, but they do take time. My feeling is the longer we stay under8600, the more chance there is of losing 8400. Still, so long as it moves, we can make money....
 

Attachments

  • dow160702.gif
    dow160702.gif
    15.7 KB · Views: 503
Amazing! Lazer guided accuracy or what!?

62% retracement and last night the DOW goes out at 8,473.11 (-166.08).

Gut feeling (what's it worth)-- wouldn't be too surprise if there's a bounce back and profit take by Friday. No advice intended; last time I had gut feelings involved a dodgy share of a Thai Green Curry ... flat on my back four days running ... couldn't even roll over onto one side ... I digress ...
 
Yonks ago (in the days when JDSU was a $60 stock) I ran a regression over "bounce" noting that, generally, if an asset (or index) falls sharply then the bounce generally retraces about half of the losses. Actually, it comes closer to "golden ratio" -- anyway, assuming the 436 point loss in DOW, then by this model you'd expect the bounce not to push much beyond 436 / 2 = 218. From low 8473 + 218 = 8691. Early days (10am Eastern) but the resistance at just over 8700 was interesting.

Anyway-- nice thread ChartMan; having been watching with interest! :) Curious to see how DOW plays out by Friday's close.

David Cobbe.
 
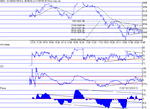
Iteresting day. Big rise in the futures before the open, and then downhill mostly. We bounced around from the new uptrend support, 62% and 50% Fib values finally closing on 50%. CCI and RSI still showing positive divergence and Phase in the upper half of its channel. Bears not able to push below support and the triangle that's forming may resolve to the upside, given the divergence.....
 

Attachments

  • dow170702.gif
    dow170702.gif
    14 KB · Views: 436
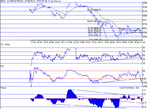
Nice try at breaking, but clearly couldn't, so it dropped through the bottom, giving us a target of 8350. After hours is just about there, currently 8361. On a closing basis we have moved from 62% to 23%, closing 15 point to the good of 23%. Losing this tomorrow will see fresh air down to the recent lows of 8260. Uptrend PD on RSI and CCI well and truly broken.
 

Attachments

  • dow180702.gif
    dow180702.gif
    15.2 KB · Views: 407
And fresh air it was. It took a time to free fall but in the end 8100 to sub 8k went in a flash. 200 lost overnight and a further 200+ in the trading day.Looking back at the weekly dow chart I posted, one has to say the 7650 has a nice ring to it as well as being a possible support at 23% (7678). The extrapolated downtrend support is at around 7900... there's a clear support Res. switch on CCI and RSI and Phase has more room to the downside before it hits channel bottom. Tin Hats for sure... That support goes back to Sept '98. Little point in mentioning the 3 slope change in the price.....
 

Attachments

  • dow190702.gif
    dow190702.gif
    14.7 KB · Views: 363
Top