The DOW This Week...14/01- 21/01

ChartMan

Legendary member
Messages
5,580
Likes
47
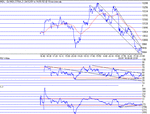
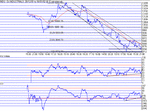
So the downtrend continues. Not altogether unexpected, really. A gradual slip down to 9900, and there was a glimmer of hope for a turnround...but not for long. The minor uptrend was broken on the second test and sank below 9900. From a TA point of view, there looks to be a lot more to come on the downside...Having said that , there a signs of positive divergence on 1, 5 and 10 min charts. Strong support exists at 9884, and we're very close to that. Next down is 9784, and below that it's almost freefall with no major support until the 9000 area.If you're feeling lucky, the minor uptrend break could just be an end of day sellof and tomorrow will revert to the upside.
100MA at 9992- 100pts above close...Point to watch tomorrow is holding 9884....
 

Attachments

  • dow140102.gif
    dow140102.gif
    14 KB · Views: 433
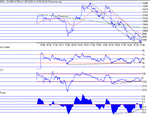
Looks like we were in luck today. Not a major turnaround, but then it was never going to be that. Almost a 100 point flyer at the open that couldn't hold water. The inevitable retrace followed, down to retest 9884, that failed, briefly to 9867, followed by a further test at 9868, and a good end to close at 9924. Intraday followers should have got the strong pos. divergence off the second bottom at 9868 to call a confident long.The signs are there for the end of the downtrend. Today's close was just about above the upper downtrend resistance line and if the DOW can hold above 9900 tomorrow, then we could get a confirmed trend break.Longer term positive divergence of CCI and Phase from 10/01 continues to support a trend break. Please bear in mind that whilst I rely on PD's, there is really no knowing when ( and sometimes if) a major break will occur on longer time scales. Short term, like todays double bottom are easily confirmed by virtue of the fact that there is a double confirmation. The closer together the lows or bottoms, the more likely PD will confirm a break.
Today's 1 min and 5 min charts show strong PD from the low at 9890 and the double bottoms around 9867.
If tomorrow can hold 9900, then I think we are off on a new uptrend. Failure ( on a closing basis) will lead to more downside as indicated yesterday.
100MA 9957 : Support 9984 9884 : Resistance 10k 10,032,10,096
Regression 10.032
 

Attachments

  • dow150102.gif
    dow150102.gif
    13.8 KB · Views: 396
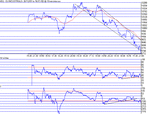
The trend break didn't happen, and so the only way was down. The longer term PD was broken too, confirming no chance of any upside. A 110 point drop on open and then a slow drift down to close at 9712, below support at 9728 and the lower downtrend support line......The rate of change towards close was a bit steep and so there is a chance of some upside tomorrow. The overall trend though is still firmly down, with no sign of a reversal. The slim chance of a reversal yesterday has been completely wiped out.
100MA at 9862...Support at 9728,9549,9472,9216; Resistance at 9784 9884
If 9728 fails to hold, there is a big drop to the next support at 9549.
 

Attachments

  • dow160102.gif
    dow160102.gif
    13.7 KB · Views: 391
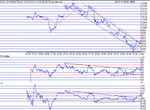
So who threw the DOW a lifeline? Just as it looked like a bottomless pit, it recovers. Up almost a 100 points at the open , then a dive to deja vue, almost....Interestingly, that bottom bounced exactly off the lower downtrend support line at 9744! But then we'd all seen that before this last several days on numerous occaisions and you would have been forgiven for waiting for the inevitable tank. But it never came. Just more and more up. By 17:00 we were testing the downtrend resistance.. a couple of wobbles and it was through. More importantly, it held to the close, having spent 2 hours tracking down the resistance slope (which is now support). Finally a breakaway from support to half confirm the new uptrend and close at 9850. The 1 min chart RSI shows a nice bull triangle,and if this performs tomorrow, we should see at least 50 points to the upside.Both RSI and CCI closed strong on all time frames up to 60 mins. Once again, the longer term pos. divergence came good, eventually, after 3 days.
It's taken 10 days to drop 500 points or so, and following on from the last rally we can expect to be back at 10,250 in 10 trading days time.....based on the fact that the last few trend line slope angles have been similar for the rise and falls......Rock on :)
100MA 9837; Support 9800, 9784,9712; Resistance 9872, 9900, 10K, 10,032, 10,128.
Looking forward to 10K on Tuesday :)..... all being well.
 

Attachments

  • dow170102.gif
    dow170102.gif
    14 KB · Views: 318
Another sad day :( Far from continuing the breakout, we just slipped down the old resistance line, finally bouncing off 9740 where this met horizontal short term support. Resistance and support at 9784 was tested several times, and bounced off that just prior to closing at 9770, 5 points above the 100MA at 9765. Instead of a breakout, we may just have been having a 50 point correction to the upside. For sure, there was no real confidence to the breakout, but we didn't get savaged by the bears. Notice the Fib. points from the last high and how the bounce points correlate...... Monday is a holiday in the us ( Martin Luther King Day) so we'll continue on Tuesday.
Support 9744,9712 ; Resistance 9784,9808, 9884.
 

Attachments

  • dow180102a.gif
    dow180102a.gif
    14.7 KB · Views: 334
Top