The DOW this week 10/06 - 14/06

ChartMan

Legendary member
Messages
5,580
Likes
47
Good start to the week. 4 slope changes and a breakthrough of the second slope looks like confirming a new up-trend, with an upper limit of around 9770 .Closed just above the 100 MA at 9645. Still a long way to go before I can put my bull hat back on....
100MA 9637: Support: 9623,9600,9568. Resistance: 9664,9706,9732,9760,9800.
 

Attachments

  • dow100602.gif
    dow100602.gif
    15.3 KB · Views: 537
Good job I didn't put my Bull Hat on..... Seems I didn't go low enough on support values....If 9480 fails to hold, there's a lot of fresh air below...
100MA: 9636. Support 9510, 9480,fresh air. Resistance: 9550,9576,9607, 9632,9650,9680.
 

Attachments

  • dow110602.gif
    dow110602.gif
    17.3 KB · Views: 497
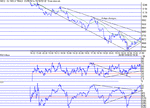
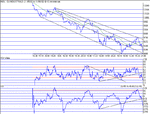
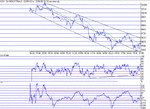
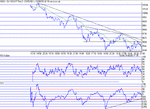
Well, 9480 didn't hold, but we found a double bottom at 9450 that may be the turning point. While we're on the subject, it really doesn't matter what the dow holds for the future, be it 9000, 8000 or 12,000. We are only interested on daily volatility and being on the right side of the market, most of the time....If I say, in response to the question " where are we heading next week" 8000;- It really doesn't matter a hoot as far as trading the dow goes.I don't even care whether it goes up or down tomorrow, so long as it moves somewhere new!
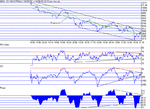
Any way , today was a mixture,producing a "W" and a "double Inv H&S" bottom at 9450. From that point there was an excellent rally into the close, finishing 10 points off HOD at 9616.
It is encouraging to see a TA formation performing at a bottom on the 10 min chart, in exactly the same way that we see on the 1 min chart- confirmation of the TA formation as it crosses the 100 MA....at 9575. A sort of bounce off the middle trend line and close above the 100MA should lead to some more upside, but watch downtrend resistance at 9664 ish... Phase has moved from heavily negative into positive territory but it may be a case of too much too quick into the close.
100MA: 9577. Support: 9606, 9564,9530,9485. Resistance: 9650,9700
 

Attachments

  • dow120602.gif
    dow120602.gif
    14.8 KB · Views: 481
Well, it was too much too soon. 9606 was never seen at the open, tanking to 9575, then following a short pullback, to 9512 for a tripple bottom. This was followed by another strong 100+ point rally to retest the highs and made a double top at around 9620. One could have been forgiven for thinking we were away ....but ... Another drop and re-test of 9606 followed, and this time at really was the end of the uptrend and a good drop down to the close, sitting under the 100MA all the way down.
Looks to be substantial horizontal support/resistance at 9608.
Support may be found around horizontal 9450-80 with CCI and phase being in PD. Wether the divergence becomes effective will depend on tomorrow's action.
100MA :9567. Support: 9500,9479, 9455. Resistance: 9524, 9538,9564,9606.
 

Attachments

  • dow130602.gif
    dow130602.gif
    14.6 KB · Views: 437
What a blockbuster day...The PD didn't get a look in, futures were 123 points down just before the open... If my AIQ charts had a look forward feature, I could have said that down trend support was at 9280. Unfortunately, I couldn't. :( That would have helped in picking the bottom today after the 230 point drop from the open.The rest of the day had great volatility and there was good scope for claiming big gains. There was 5-600 points to be had... The surprise of the day would be guessing the close was only 29 points down on the day.Closing above regression and just 6 points off the 100MA. Topside resistance at 9541.Really glad I didn't put the bull hat on earlier this week...... Ignoring the peaks in the indicators due to the violence of the drop, we are still looking at PD on the indicators, and triangles developing. 9464 is the crunch level....

100MA: 9480. Support: 9464,9432,9400,9364,9340.Resistance: 9500,9532,9462,9500...
 

Attachments

  • dow140602.gif
    dow140602.gif
    14.9 KB · Views: 399
Top