Client
Member
- Messages
- 64
- Likes
- 1
In this thread I want to share my observations and technical analysis of stock charts. There are thousands of stocks and other securities which can bring profit if spotted in time. Feel free to comment my posts and suggest your own opinions.
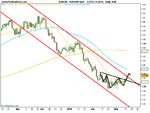
At the starting point I would like to show you some of my forecasts regarding Dow Jones Index. As you may know, few weeks ago a significant support line was broken and the index went down. Will it continue falling or rise again? The chart below that I made few two days ago shows you my point of view.

Read the rest of my analysis in the article about the Dow Jones index trading.
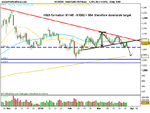
At the starting point I would like to show you some of my forecasts regarding Dow Jones Index. As you may know, few weeks ago a significant support line was broken and the index went down. Will it continue falling or rise again? The chart below that I made few two days ago shows you my point of view.
Read the rest of my analysis in the article about the Dow Jones index trading.