You are using an out of date browser. It may not display this or other websites correctly.
You should upgrade or use an alternative browser.
You should upgrade or use an alternative browser.
Best Thread The Basics of Trading
- Thread starter FTSE Beater
- Start date
- Watchers 217
CityTrader
Established member
- Messages
- 666
- Likes
- 26
Stevet :- trust me, most Hedge Funds & PM's centralised dealing desks know more about a stocks price than a MM - mainly through the IOI system. Yes, a MM will move a long position up hoping to attract buyers, but that only really works with small cap stocks with 1 or 2 market makers. AND the certain knowledge that he ( the MM) has finished all the sellers. Otherwise all that will happen is you'll have a spivvy institution on, trying to have your eyes out by selling more stock. Also, sectors being equal, a stock like (say) Cookson (CKSN) with something like 12 MM's wil be a lot less volatile than some AIM stock with only ( say) Winterflood's and maybe another MM. Also, contrary to various conspiracy theories, there is NO collusion between MM's at all. A MM may have a relationship with 1 or 2 other firms only a personal level, but generally, it is dog eat dog out there in a high stakes game. The private investor doesn't even show up on the radar. MM x would much rather **** MM y - the man in the street doesn't come into the play.
Rather than continually (try) to correct the common misunderstandings regarding MM's- I'm probably going to start teaching a seminar on " The way the market REALLy works" guess there's certain people on here who want want an invite!
Wayno
Rather than continually (try) to correct the common misunderstandings regarding MM's- I'm probably going to start teaching a seminar on " The way the market REALLy works" guess there's certain people on here who want want an invite!
Wayno
Last edited:
Stock long short risk reward ratio
KGF 270 6 14 2.33
BP 439 6 11 1.83
Barc 478 18 12 0.67
Sbry 274 4 16 4.00
Hi FTSE
I really have enjoyed reading your views and support you have been giving to the beginners. I picked up trading at the start of the year when i met genti at work. Ive now started to trade small , but i feel that after reading your advice i have picked some fundamental principals that i should have had !
I would really love some advice on the above trades and see what you think. When i find out how to post charts, ill indicate my reasons for resistence and support. My main reason for going long on all are the fact that they have all touched the up trend line and have surpassed the down trend.
would you say that SBRY has displayed the cup and handle, and do you think that there is support at 270.
Recently i have been quite succesful as i have now been following strict principles and am now moving into profit after some initial stupid trades, that i actually think have done me more good than bad.
Thanks for the help already , with your posts.
Half Butt
neil
Legendary member
- Messages
- 5,169
- Likes
- 754
A System
The below is a link to various trading systems......Look at "SNOSURF"......his system is simple and hopefully stops you overtrading...a beginner malaise.
http://www.elitetrader.com/vb/showthread.php?s=&threadid=10532&perpage=6&pagenumber=5
Hope this helps some of you.
great work FTSE.
😀
The below is a link to various trading systems......Look at "SNOSURF"......his system is simple and hopefully stops you overtrading...a beginner malaise.
http://www.elitetrader.com/vb/showthread.php?s=&threadid=10532&perpage=6&pagenumber=5
Hope this helps some of you.
great work FTSE.
😀
PitBull
Established member
- Messages
- 620
- Likes
- 59
FTSE Beater
Thanks for all the great advice, my trading strategy has improved immensely from reading your posts. I was just curious whether you are a full time day trader or you still hold a full time job?
The only reason I ask is that I would like to pursue trading as a full time job, when I am confident enough that I can consistently make money and I would like to know how you made the transition. If you are not a full time trader could you outline your typical trading days activities and how you access trades from work, as my only problem is that I have limited internet access whilst at work.
Thanks
FTSE Beater
Experienced member
- Messages
- 1,518
- Likes
- 6
Hi Pitbull
It's great to hear your trading is improving. 🙂
At the moment I'm cheating and I'm a part-time trader. I work in the mornings until 1 and from then on I trade the US market.
If your going to be trading from work, then your strategy must fit around it. You need to ask yourself, do I have constant internet access, am I going to be dragged off to meetings with positions open. If your going to be away from your desk a lot then your looking for a longer term strategy using end of day charts and looking at the quotes whenever you get a chance to.
It sounds like you can only look at quotes every so often so the above should work well 🙂
Trading from work is fine as long as 1) Your trading doesn't suffer, 2) You can still keep your trading discipline and 3) Your work doesn't suffer. I was guilty of the 3 one 😱
I made the transition when I found I was making an ok trading wage (equivalent to half my working salary) and I knew I could make more working full-time. When to change is always difficult. It's best to introduce trading slowly. If you suddenly rely on it as your only source of income then it puts too much pressure on your trading which is the last thing you want. The best way is to (when you think your ready) take 2 weeks off work, trade and see how you go.
HTH
Mr. Charts
Legendary member
- Messages
- 7,370
- Likes
- 1,200
Not sure about that, Chartman. Plenty of people do a day job and trade US stocks in the evening.
Some like having two income streams, others give up the day job voluntarily to trade. Some work part time, or on contract jobs.
I myself gradually then finally gave up my profession to trade full time and managed perfectly well in the interim.
I think it depends on the day job and what you want out of life.
I wanted more time with my family and for my interests and more money, enjoyment and above all freedom - and that was even though I had my own business and wasn't answerable to anyone.
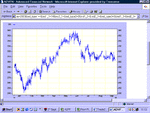
BB. chart ??????
Hi all
Ive been reading all of your excellent advise and hope im on the right thread, 😱
Ive been reading these threads and have found the lessons on support , (cup and handle i really liked ) and RR very enlightening Im not sure if its luck yet , but it im now out of the red and have had 2 weeks of good trading behind me. So thanks for all of the advise.
Im a little perplexed with BB. as im sure this must be a recognised trend , sideways of course , but what happens next :!: :!: . How would someone analyse this kind of chart and what would be their diagnosis.
Id love a reply
Hope ive pasted the chart right 😱
thanks
Halfbutt :cheesy:
Attachments
FTSE Beater
Experienced member
- Messages
- 1,518
- Likes
- 6
Hi HalfButt
It's great to hear your trading well, and a lovely chart as well 🙂
I have to agree with everything said by Neil. If you do wait for the break though (as with every trade), make sure the RR of the trade is still good.
I'm hopefully going to be looking at triangles this week. After that, I haven't planned anything, so feel free to put ideas my way 🙂
I've also had a few requests to do a Word and PDF version of this thread which is currently in development.
Thanks Guys, great to get a reply. Its so good being part of this circle, getting advise from experienced people.
In think ill leave this one alone for a while even though its in my portfolio. Ive always wanted to go long at 303 and would have made some points, but i havnt got enough credible reasoning behind this decision.
look forward to the Triangles FTSE
Barjon... sorry to ask such juvenile questions , but what does IMO mean
thanks
Halfbutt
barjon
Legendary member
- Messages
- 10,752
- Likes
- 1,863
halfbutt
neil's already said imo & imho!!
there is some rationale for a long @ 303 since 300 has
represented fairly solid support and also happens to be the
fibonacci 50% retracement level of the late january to june move.
298 would be a reasonable stop, 320 a first target since there
has been three or four setbacks around this level and the gap to
335 maybe a maximum target. a 5 or 6 point stop and a target
area of 17+ would give you a reward:risk of around 3:1 so not a
bad trade in theory.
not suggesting you should trade it (particularly if you like to see
the ftse confirming your trade direction as I do) but just going
through the analysis to show there was maybe more to your
feelings than you thought!!
good trading
jon
Thanks Barjon.
Im a bit scared to even ask what the FIBONACCI 50% retarctment level means as i think this may be a lesson for the future.
Im assuming in layman terms that it is the mid quote between these months , but how you would use this for analysis would be beyond me. Even the word sends shivers down my spine and reiterates how much i have to learn.
regards
Halfbutt
barjon
Legendary member
- Messages
- 10,752
- Likes
- 1,863
halfbutt
Fibonacci was an ancient mathematician (circa 1170) who
discovered the relationship of what are now referred to as
Fibonacci numbers while studying the Great Pyramid of Gizeh in
Egypt.
After a significant price move prices often retrace a significant
portion of the original move. As prices retrace, support and
resistance levels often occur at or near Fibonacci Retracement
levels of 24%, 38%, 50% and 62% with 50% being the most
significant.
Don't ask how Fibonacci arrived at his numbers, but they do seem
to work!!
jon
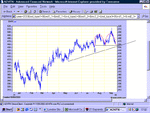
Hi all :cheesy:
Another question please
Hopefully BARC will be attached :!: :!:
Is there a recognised movement in the same terms as head and sholder with regards to an instrument displaying an "M"
If you look at BARC it appears to be uniform in its creation as the middle low is vritually in the middle of the "M" shape. I recognise the 4 points of support at 57 but am wondering if there is anymore significance regarding its movement from early August to late Sept.
Hope you understand what im trying to ask 😱
thanks again for all of your replys
Halfbutt
Attachments
frugi
1
- Messages
- 1,843
- Likes
- 133
HB,
Fibonacci retracement levels are derived from a simple series of numbers discovered by Leondardo Fibonacci in the 12th century.
It starts 0, 1, 1, 2, 3, 5, 8, 13, 21, 34, 55, 89, 144, 233, 377 . . .
Starting with 0 and 1 each successive number is the sum of the previous two.
The ratio of each successive pair of numbers in the series soon approximates 1.618 (known as 'phi'). This approximation becomes ever more accurate as the series grows. e.g 144/89 = 1.61798
1.618 is known as the golden mean or golden ratio and it crops up frequently in nature, art, music, architecture and trading to name but a few instances.
In trading 61.8% is a common price retracement level, as are the other two. (38.2% is merely 100% minus 61.8%. I do not know why 50% is attributed to Fibonacci but I'm sure someone will).
More (slightly oversimplified) info here:
http://goldennumber.net/neophite.htm
Why this series should intrude on human market interaction nobody really knows, but Fib retracement levels certainly occur more than a random distribution would imply. Perhaps it is simply a self fulfilling prophecy, as many traders are watching these levels, perhaps not. Often worth incorporating, if only by way of a glance, into your trading IMHO.
If you look at your BARC chart as far back as the high of 633p in May 2002, you will notice that the 61.8% retracement level from this high down to the March low of 310p is 510p, almost exactly where there was a significant reversal mid September.
Regarding your M-shape question I don't think there is a specific name for this formation. However with a new leg up now it could develop into a W shape which often marks a bottom. A W shape that surpassed the previous high and Fib level at 510p would confirm the bottom and point to further upside. Conversely a failure of the support you note at 457p would point down to a new leg down to 433p or so (I think).
The M shape could also develop into a H&S if the right shoulder rallied to 490p or so and then dropped back to the neckline, which would be 457p.
Last edited:
FTSE Beater
Experienced member
- Messages
- 1,518
- Likes
- 6
Hi HalfButt
That looks like a very good chart 🙂
Not sure there is an "M" charting pattern. A Head and Shoulders pattern would be formed if it went back up to 490 and then fell away.
That looks like a very good chart 🙂
Not sure there is an "M" charting pattern. A Head and Shoulders pattern would be formed if it went back up to 490 and then fell away.
Similar threads
- Replies
- 3
- Views
- 5K