Best Thread The Basics of Trading

Ive known an "M" referred to as "Inverted W" and both as double tops and bottoms respectively.

Just because its not in a book doesnt mean its not a valid patten, a new phenomenon could be occurring.... hold on it my idea and i'll have a book out by the end of the month :LOL: lol
 
Thanks Guys
As i speak, Barc has gone in the right direction and as usual i normally get out and bank a profit ( he says as if hes always winning and not losing !!!!!!!)
My dilema now is, i have told my self to wait for 495, but my fingers want to bank a profit. If i move my stop , my mind is saying " If it goes down and hits your stop, you will have lost more of your profit, and you know what , it will then go to 495.
Anyway, thats what im going to do , move my stop and wait and see if it goes to 495 and lets hope this style will get me more points. My only concern with this is , is greed for points stopping me from taking a definte profit now ??
Hope you guys understand how my brain is ticking.

Halfbutt
 
halfbutt
In this case from your analysis you are expecting the target to get to 495...
you can either cover your entry so that it will never be a loosing trade, if your itchy now then your position size may be too big or your subconscious is trying to tell you something, or you an take half profits and see if the other half will make it to your target

Just some suggestions that spring to mind am sure others may have something more to contribute with a bit more thought

Remember thought you have made a trading plan so stick to it and amend it when and only when there is new information that would change your opinion and therefore the trading plan

HTH
 
hb

we've all been there!! courage mon brave

if where it is now is showing you 3:1 against your initial stop
level (ie your profit is x3 your original potential loss) then you
won't go far wrong cashing in even if it goes on to greater
things this time.

good trading
 
hb,
you could always sell a seperate bank,with weaker looking charts.
LLOY,ANL maybe???

cheers
 
Halfbutt said:
Thanks frugi. thats very informative.

No worries. In fact, thank you for finding the chart in the first place. :cool:
I too went long yesterday at 464, OCO sell at 454/484. Bid got to 483 today and the US looks strong so I've moved the stop to breakeven 464. A free position is a good position!

A 1:2 risk to reward ratio isn't ideal I admit but it'll do as long as more than one in three trades are profitable.


http://www.frugi.co.uk/trading/barc.htm
 
Frugi... its great to hear i have inadvertantly helped you in a small way. Liked your link too on Neophite.

I think ill let BARC run as it closed well today. A few more points and some nice profit hopefully. and since finding this site my trading is going blue.... thanks to all of you guys providing advice.
I dont think my style is quite as indepth as the other newbie , Gordon8 appears to be leaning towards , as im trying to keep it simple and that worries me a bit.
cheers
Halfbutt
 
Halfbutt said:
Thanks Guys
My dilema now is, i have told my self to wait for 495, but my fingers want to bank a profit. If i move my stop , my mind is saying " If it goes down and hits your stop, you will have lost more of your profit, and you know what , it will then go to 495.

Hi Halfbutt

Just remember to look at your current position and if it is approaching your target, then tighten your stop so you still have at least a 2:1 ratio. Ideally 3:1

HTH :)
 
Thanks FTSE, Not sure if its the right eitquette to post charts all the time and ask for advise in this way :eek: so youll all have to let me know . :rolleyes:
I held onto my fingers till 493 ( barc)which was more luck than judgement.
Im wondering what you guys think of SBRY at the moment. Could this be the beginning of a right sholder at the neck line ( he says as if he knows what he is talking about :eek: :eek: )
Its saying support to me :idea: , so i think it would be a good to have a RR at 260/290, 2:1 . Ill be really interested if you guys are going to say something else :!:
thanks

Halfbutt :D
 

Attachments

  • sbry.gif
    sbry.gif
    26.2 KB · Views: 897
no reason other than the fact that i would have closed my trade at 260, should it go against me. so, although i could see this i think ill be out well before. fingers crossed for 290 or it that a bit too much to wish for. i appreciate any traders experienced views
cheers

HB
 
Hi HalfButt

Posting charts is only a problem if you need others to do your research for you. As long as you post a chart and your view, then it's an excellent way to learn :)

This is how I see the chart:

SBRY031003.png


The trendline that Oatman pointed out is the important one. At the moment the price is just bouncing around the trendline, so there is no trade there for me. I would have wanted to see a clean bounce up off the trendline or a sharp sell-off as price fell through it. Neither has happened so there is no trade for me there

HTH :)
 
Hi all

I must apologise for the delay in getting to this section. I hope it is worth waiting for :)


Triangles

Triangles are made up by the interaction of support, resistance and trendlines. The main ones are descending, ascending, symmetrical and expanding:


Descending Triangle

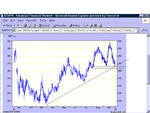
This is the chart of the FTSE index back in Aug 2001

ukx06-07-032.GIF


Here, the bottom of the triangle is a horizontal line and the top is made up of the trendline, so in this example the triangle is the interaction of the support line and trendline.

On the chart I’ve labelled points A-G.

A, B, C make up the base
D, E, make up the top
F is the failed attempt to hit the trendline again.
G is the break-out point

Descending Triangles SHOULD break to the downside. The reason is that every time the price bounces off the support line, price doesn’t go up as far as the last time. This is showing that there is more sellers in the market than buyers. The buyers are trying to bring the price up, but after every bounce there is less people wanting to buy so the price doesn’t travel up as far.
If there is less buyers in the market, then the price goes down and the sellers win the battle. Once the support line goes, then the break-out traders come in selling the stock and this causes the price drop.

The best way to explain it is that between points A & D, price rose about 400 points. The next time the support line was tested at point B the price only travelled to point E, only 200 points. The final bounce off C only made it up about 100 points and it didn’t have the buying power to reach and test point F. With the bounces getting smaller and smaller, the only way was down. As a side point, the sell-off started before 9/11 and the FTSE had already lost 200 points before 9/11, so the market was in steep decline.


Ascending Triangle

Ascending Triangles are the same as Descending triangles only upside-down, and they SHOULD break to the upside, as there is more buyers in the market than sellers

INTU06-07-03.GIF


Here, the top of the triangle is a horizontal line and the bottom is made up of the trendline, so in this example the triangle is the interaction of the resistance line and trendline.


Symmetric Triangle

A Symmetrical triangle is made up of 2 trendlines that get closer together.

SUNW181003.png


Symmetrical triangles are rare in the market. I’ve taken this from an example on www.stockcharts.com.
Here the 2 trendlines have come together and the market has broken upwards. Once a trendline breaks then the price will normally carry on in that direction. Which way the price will break from within the triangle is 50:50. As far as I’m aware the likelihood of it breaking up is the same as it breaking down.


Expanding Triangle

BUND181003.png


An Expanding triangle is made up of 2 trendlines that get further apart. These are harder to trade, because if you base your stop on the break of the trendline against you, each day your risk is increasing :(


There are a few other types of triangles, but these are the main ones and the ones that occur the most. The important thing is to draw in the major support, resistance and trendlines, and see how they are interacting with each other. From that you can make a judgement about risk, reward and any potential trade that you see developing.


I haven’t done this for a while, so I thought I would give you these situations to look at. For all of the charts, we’ll be looking at the EOD chart, over the last 6 months.
Those of you with a good eye might be able to spot the triangle in CNA that has already broken ;)

<table border="1" cellpadding="2"> <tr><td>No.</td><td>Ticker</td><td>Name</td><td>Long/Short</td><td>T2W Online Charting Link</td></tr> <tr><td>1</td><td>BA.</td><td>BAE Systems</td><td>Short</td><td>BAE Chart</td></tr> <tr><td>2</td><td>BARC</td><td>Barclays </td><td>Short</td><td>BARC Chart</td></tr> <tr><td>3</td><td>CNA</td><td>Centrica</td><td>Long</td><td>CNA Chart </td></tr> <tr><td>4</td><td>CW.</td><td>Cable & Wireless</td><td>Long</td><td>CW. Chart</td></tr> <tr><td>5</td><td>GSK</td><td>GlaxoSmithKline</td><td>Long</td><td>GSK Chart</td></tr> </table>

You can post charts or just write down your stop-loss, targets and risk / reward. As always there is no right or wrong answers and I would love to hear your views :)


My plan for this week is to do a PDF and Word document version of this thread, so those who want to can download it and look at it in their own time :)
 
Okey dokey, here we go.
I’m afraid I don’t have any charts to post so I hope it all makes sense.

BAE Systems
This looks like an expanding triangle in the long term, with support at about 160.
More recently there seems to be a 2 point resistance at around 196 with a upward trendline developing towards it. Which could end up as a ascending triangle.
I can’t really see anything more here I’m afraid. The possibility of the ascending triangle is probably worth keeping an eye on, but with only 2 points making the recent support and resistance, it seems a little thin!

Barclays
I think I’ll use DangerMouse as my logo, he’s got a patch over his eye, and I feel I have a patch over both when it comes to some of these charts!
Still, this looks again like an expanding triangle (just), I can see a support at about 460, cant really see any triangles developing.
However, at the end of April through May there seems to be support around 400, with a trendline going down from 450 to meet it, which would have looked like a descending triangle except it broke long. It would be so much easier if these patterns stuck to the rules!
Anyway as you can see Barclays is a bit of a mystery to me so I’m liking forward to being enlightened!

Centraca
Seems to be a resistance line at about 188 which was broken by an upward trendline at the beginning of September, then came back through it.
Other than that there’s a symmetric triangle with a downward trendline from mid September coming to meet the longer upwardly mobile trendline.

C&W
Support at 106
Resistance at 129?
Trendline going from the last week in September up to the resistance of 129.
If the price breaks through 130, then target of 152 (height of the base of the triangle above the break – not sure where I heard that one)
Stop @124
Risk 4ish

Glaxo
Ascending triangle
Resistance 1304
Rising trrendline from 1st week in August
If price breaks above 1304 then
Target 1450
Stop1269
R/R 5

I hope you can tell what I’m seeing (or not) from this. Sorry about the lack of charts. Look forward to seeing other views!

Cheers

Rich
 
FTSE, thanks for the info, very good once again. looking forward to FIBS also.
Just a quick one to butt in slightly . What do you think of Dazzams thread, " a simple strategy"
what do you think of it in principle and if you thought there was weight behind it, what indicators would you introduce to achieve %percent success
HB
 
Halfbutt said:
FTSE, thanks for the info, very good once again. looking forward to FIBS also.
Just a quick one to butt in slightly . What do you think of Dazzams thread, " a simple strategy"
what do you think of it in principle and if you thought there was weight behind it, what indicators would you introduce to achieve %percent success
HB

Hi HB,

could you define '% success'?

Cheers
 
Hi Rich

Thank you for posting. I'll give it another day or 2 to give others a chance to comment, before I show my view :)

<hr>
Hi HalfButt

The answer is I wouldn't add anything else to it. I would be more interested in applying TA to those that appear on a short-list. The principle is a good one, but I would only use it to filter out dull stocks

HTH :)
 
FTSE. what do you mean when you say you would only use it to filter out dull stocks.

Cheers

Halfbutt
 
Hi HalfButt

The strategy (if I've got it correct) picks up shares that have moved strongly in one day with the aim of them moving in the same direction. This would eliminate a large number of stocks that haven't done much in the day. The ones your left with, you then apply TA & money management to them to get some trades :)

If I've got it right, it seems like a good strategy.

HTH
 
Top