SoldierOfOne said:Hi NI
Just checked with your post…we seem to have called the charts in the same direction (!?!) but you are definitely more aggressive than me on Barclays and M&S; this may be a function of time between analysis perhaps.
Yeah well the clue is in the original task set by FB. I certainly ain't more aggressive, more likely ignorant :cheesy:
Out of curiosity, what is your thinking for a target of 480p for BARC?
Seemed like a nice figure 😆 also looked for a longer term gain and 480 popped up as resistance several times over Oct/Nov period. But you are probably more closer to the mark with your comments below. Still, I ain't no expert, so it could be either view point.
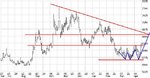
mmm...<thinking mode>... On my rising neckline (or am I seeing things?), I was thinking of seeing if it was tested first; if there was a breakout upwards at this point then I would employ a rising stop loss (c 410p) and look for the 480p figure...
You are using an out of date browser. It may not display this or other websites correctly.
You should upgrade or use an alternative browser.
You should upgrade or use an alternative browser.
Best Thread The Basics of Trading
- Thread starter FTSE Beater
- Start date
- Watchers 217
FTSE Beater
Experienced member
- Messages
- 1,518
- Likes
- 6
Hi all
Apologies for the delay in getting back to you 🙁
BARC

Stop for me would be just under the last range, and looking for a break upwards to 480 🙂
NastyItch. May I ask why you thought a stop at 240 was a good idea. I presume it was a mis-type, unless I missed something 🙁. Your target was spot on though.
SoldierOfOne. Firstly, well done for not looking at NI's post, as you need make trading decisions yourself 🙂
I love the nice tight stop, and I can see why your target was 410. The reason I think 480 is better is because once the price breaks above 400, then 410 should get taken out very quickly. If the price did break above 410, then that would make a good place for the stop to lock in some profit 🙂
DXNS

Stop at 98 just above the last high, and a target of 78. Not an ideal place to short, but with wide candles it should get to where it wants to quickly.
NastyItch, perfect target. The stop would need to be a little bit higher for EOD trading, as you need to give the stock room to move. You said you would trade intraday which means the stop is in the perfect place. 🙂
SoldierOfOne. Great stop, the target of 70 is a bit ambitious as the low would have to get taken out.
MKS

Nice and simple, target and stop at either ends of the range. 🙂
NastyItch. Again I think the stop is a little tight for EOD, but intraday it's perfect.
SoldierOfOne. I would the say stop could do with being at 260, but it looks like your trading the gap, which is never a bad thing.
OML

The stop would be the previous high and the down trendline. The target would be the March Low.
NastyItch. That looks like a nice breakdown trade you have planned, shorting at 75 with a tight stop at 77 could give you a problem if trading EOD, but if your able to watch it then great.
SoldierOfOne. Same comments as for NI on the short side. I think the long R/R is too low to trade though 🙁
TSCO

ARGH - Why do I always put a tricky share in. Seemed a good idea at the time 😱
Target would be the trendline, and a stop of the recent low. I also included a support level on the chart, but the stop is tighter to give a better R/R. Don't like this one though.
NastyItch. Perfect, I'll go with that.
SoldierOfOne. Not quite sure why you think 170 would be a good point? The problem is, if it gets that low, then it's in a downtrend and therefore a high risk trade.
Thank you both for putting your necks out and having a go, and apologies again for the delayed reply.
Take care.
Apologies for the delay in getting back to you 🙁
BARC
Stop for me would be just under the last range, and looking for a break upwards to 480 🙂
NastyItch. May I ask why you thought a stop at 240 was a good idea. I presume it was a mis-type, unless I missed something 🙁. Your target was spot on though.
SoldierOfOne. Firstly, well done for not looking at NI's post, as you need make trading decisions yourself 🙂
I love the nice tight stop, and I can see why your target was 410. The reason I think 480 is better is because once the price breaks above 400, then 410 should get taken out very quickly. If the price did break above 410, then that would make a good place for the stop to lock in some profit 🙂
DXNS
Stop at 98 just above the last high, and a target of 78. Not an ideal place to short, but with wide candles it should get to where it wants to quickly.
NastyItch, perfect target. The stop would need to be a little bit higher for EOD trading, as you need to give the stock room to move. You said you would trade intraday which means the stop is in the perfect place. 🙂
SoldierOfOne. Great stop, the target of 70 is a bit ambitious as the low would have to get taken out.
MKS
Nice and simple, target and stop at either ends of the range. 🙂
NastyItch. Again I think the stop is a little tight for EOD, but intraday it's perfect.
SoldierOfOne. I would the say stop could do with being at 260, but it looks like your trading the gap, which is never a bad thing.
OML
The stop would be the previous high and the down trendline. The target would be the March Low.
NastyItch. That looks like a nice breakdown trade you have planned, shorting at 75 with a tight stop at 77 could give you a problem if trading EOD, but if your able to watch it then great.
SoldierOfOne. Same comments as for NI on the short side. I think the long R/R is too low to trade though 🙁
TSCO
ARGH - Why do I always put a tricky share in. Seemed a good idea at the time 😱
Target would be the trendline, and a stop of the recent low. I also included a support level on the chart, but the stop is tighter to give a better R/R. Don't like this one though.
NastyItch. Perfect, I'll go with that.
SoldierOfOne. Not quite sure why you think 170 would be a good point? The problem is, if it gets that low, then it's in a downtrend and therefore a high risk trade.
Thank you both for putting your necks out and having a go, and apologies again for the delayed reply.
Take care.
FTSEBEATER.
Thanks again for your tuition,I am still taking note of your trading methods even though i did not offer my input this time.
I wanted to give the others a chance to put up their idea's.
I got 4 out of the five correct and noted your trend lines and S&R
lines.
I have improved my trading technique and stopped making stupid trades since I found your posts.I did not have a clue about R/R
before I asked the question some time ago, I must say it was my question that started the topic of R/R on the 28th and 29th Jan.
I have traded Barclays Bank and made some dosh several times using your method and hope to improve my winning trades .
Thanks again.
Hi FB
Thanks for the response and encouragement. Now to convert it to the competition :cheesy: :cheesy:
Yes my Barc was a SERIOUS mistype, should have read 420 and everything else makes more sense. Just as well I am not trading live yet :!:
You are quite right about my stops/limits being set for Intraday rather than EOD. The view I took when going through these charts was to try and trade them for some reasonable R/R even if this meant some shares needed to be traded Intraday and others over a few weeks (perhaps even months). At this stage I was only concerned with identifying entry points with stops and limits. A VERY GOOD EXCERCISE (imho).
One thing puzzles me though. In several cases I used overall trend (sometimes the charts I was using were 1 or 3 year charts) to determine the extent of a move when establishing my exit point. In all cases I used obvious support and resistance (in short and longer term charts) to influence my decisions. THE QUESTIONS (finally)
How come on TSCO (well you said it was tricky 😆 ) you used the trendline as the target?
When do you decide when to use trendlines and when to use support/resistance when establishing exit points?
Thanks again for the V. helpful response.
Cheers
FTSE Beater
Experienced member
- Messages
- 1,518
- Likes
- 6
Fluke said:I have traded Barclays Bank and made some dosh several times using your method and hope to improve my winning trades .
Hi Fluke
If you only knew how much pleasure and pride I take in reading that - it makes everything I have done worthwhile!!!
The best bit was you took money on Barclays - a company I HATE with a passion :cheesy:
Keep the "Stupid trades" to a minimum and enjoy the profits. 🙂
Hi NI
Phew!! I'm glad the Barc price was a mis-type
I agree with your point about sometimes needing to trade intraday if thats whats called for. The idea behind the exercise is to try and make the best of a potentially bad situation - just in case you find you've left a trade open you thought you had closed.
How come on TSCO (well you said it was tricky ) you used the trendline as the target?
When do you decide when to use trendlines and when to use support/resistance when establishing exit points?
It's simply which one is closest to the price action. Maybe not quite as simple as that as there are different types of strength associated with trendline, support and resistance, (for example the longer a trendline has been in force, the more powerful it is said to be), but as a guide I use the closest one.
HTH and as always if anyone has any other questions, please feel free to post them here, Private message or E-mail me. 🙂
FTSE Beater
Experienced member
- Messages
- 1,518
- Likes
- 6
Hi all
I thought I would throw the thread open to anyone who wants to analyze a chart and post it up with details of direction, stop-loss placement, target and Risk / Reward ratio 🙂
If your stuck on what to analyze, you might want to have a look at:
I thought I would throw the thread open to anyone who wants to analyze a chart and post it up with details of direction, stop-loss placement, target and Risk / Reward ratio 🙂
If your stuck on what to analyze, you might want to have a look at:
- AV.: Aviva (Advfn chart link)
- BAY: British Airways (Advfn chart link)
- MRW: Morrison (Advfn chart link)
- VOD: Vodafone (Advfn chart link)
Hi FB
Here is my analysis on the charts you suggested
BAY
Enter long at 118.5
stop 117.2
limit 122
R/R 2.69
AV.
Enter long at 392
stop 387
limit 415
R/R 4.6
MRW
FWIW, but I would steer clear of this one myself
Enter long at 191
stop 184
limit 200
R/R 1.29
VOD
Wouldn't trade this at all. Don't even want to hazard a guess.
Question time
How do you select stocks/indices etc to begin looking at the charts?
I have found myself following others after the action has all taken place. How do they know which stocks are about to move :?:
Cheers
How do you select stocks/indices etc to begin looking at the charts?
I have found myself following others after the action has all taken place. How do they know which stocks are about to move
The more often that you look at a set of charts, the more you get to understand their price action and the quicker you analysis becomes.
So, you could start with the FTSE100, look at every 1 year chart, this will very quickly give you a list of companies that at least move - weeding out those that do very little.
This will probably get you down to about 85 charts.
Now go through the 85 companies and look for areas of support and resistance, get an idea of the trends and what you may deem to be important levels.
Finally , go through again looking at the charts where the price level is close to your improtant levels, this will give you the basis of a set of charts - say 10 that become your 'universe'. Keep a close watch on these charts on a daily basis, get to know and love them! Hopefully, somewhere in this set you have stocks that are capable of moving, have decent volume etc..
Every day look through those charts, every week flick through the 85, and every month do the whole lot.
After a few weeks you will find yourself knowing the major levels across most of the FTSE100, and after a few months it will take you as long as it takes to pull a chart up to whizz through the whole lot.
SoldierOfOne
Junior member
- Messages
- 39
- Likes
- 0
Hi FTSE Beater
I’ve looked at these charts and not keen to trade any…yet.
Here is what these charts are saying to me:
AV.
support at 340p
resistance at 460p
from mid Dec, seem to be in a descending triangle (I see a falling trendline)
so, I’d wait and see if the chart made 410p
if it breaks through, go LONG and look for 460p
if it meet resistance, go SHORT and look for 350p (i.e. a little above 340p)
BAY
Support at 100p
Resistance at 125p
Rising trendline since mid March…
if bounces off this line at say 115p, go LONG to 125p (not sure its worth it?)
if falls through, target would be 100p
MRW
Support at 170p
Resistance at 200p
And beyond this, nothing jumps out at me. SHORT as it reaches 200p, aiming for 170p?
VOD
Support at 110p
Possible completion of double top if chart moves to this level; if it does, SHORT to 100p? (again, not sure if worth it?)
NI – are you looking at intraday movements here? Hope its going well.
TBS – I tried over the weekend to begin looking at the FTSE100 charts and making my notes. After 1.5 hours my concentration was on the way out and I’d done…10 charts !! (this includes waiting for FT.com to upload, copy into paintjet, draw lines all over the chart and enter pertinent comments into a spreadsheet). Saturday night, managed 17 in about the same period (if only because I decided there was nothing to see in some)…hopefully things will speed up!
Cheers in a slowly plodding sort of way,
SoldierofOne
Hi TBS
Thanks for the very useful reply 😎 . Probably one to print out and rehearse a few times. As it turns out I don't seem to spend too much time staring at a chart and very rarely actually draw lines. Perhaps this isn't the greatest idea but time pressures recently ... I find I can spot trend, support, resistance, entry, exit, stops etc in a few minutes. (here's hoping FB will bear my analysis out once again 😆 )
There's nothing quite like a bit of a methodology 😉 to focus you in a rather vague environment :cheesy:
Soldier
Took a look at the chart FB suggested in the timeframe he suggested. Nothing appealed, went to a 1 year chart, nothing appealed, moved on to the next challenge in life 😆 😆
Cheers
TBS – I tried over the weekend to begin looking at the FTSE100 charts and making my notes. After 1.5 hours my concentration was on the way out and I’d done…10 charts !! (this includes waiting for FT.com to upload, copy into paintjet, draw lines all over the chart and enter pertinent comments into a spreadsheet). Saturday night, managed 17 in about the same period (if only because I decided there was nothing to see in some)…hopefully things will speed up!
Things should speed up, but don't go mad with paint progs etc, wait until you have narrowed it down before going into that kind of detail.
Things should speed up, but don't go mad with paint progs etc, wait until you have narrowed it down before going into that kind of detail.
FTSE Beater
Experienced member
- Messages
- 1,518
- Likes
- 6
Hi NI and SoldierOfOne
I will give you my view of the share charts in the days to come (give others to a chance to comment).
In the meantime I would like to agree with everything that TBS has said. I would say I only search the FTSE 100 because anything else hasn't got enough volume for me. I would also say that there are only about 50 tradable stocks in the FTSE 100 (which goes to prove Naz's point that the US is more tradable), but the other 50 throw up some gems occasionally 🙂
SoldierOfOne, it does get easier to scan for stocks. I remember one day going through the complete FTSE 100 and drawing every major trendline. Once it was done, I rarely need to look at them in detail, just do a 5 minute flick in the evening. Being able to flick is one feature that both Sharescope (UK) and TC2000 (US) do very well IMO.
HTH 🙂
Hi FB
A couple of thoughts on the charts you posted:
MRW - not very enlightening! Short term this is long with a target (very rough) of 193 and 203 - old support levels. Stop at 172. I would not trade this.
VOD - becoming interesting as it approaches the resistance at 125. If it breaks then 143 is on otherwise reverses with downside target of 108. This is currently Long and Fibonacci looks a good fit. Trade as a long when it breaks, otherwise look elsewhere.
BAY - Long term short - since 20/05/02. The descending triangle is either big or very big! depends on your time scale. 132 is resistance and 128 is Fibonacci retracement at 23.6%. This triangle is getting very compressed. If it breaks the supply trendline then successive targets are 150 and 170. There is a big double bottom at ~90 which would give a target of 250 which is the 100% retracement - looking very interesting. I'm in wait and see mode.
AV. - Long term short since 29/08/01 with a couple of descending triangles evident - both coming to the boil. The price action is becoming very compressed and could go either way. The supply line is VERY strong so if it breaks this could fly! However this could go to new lows then we are looking into the abyss. Support is at the Demand trendline - currently 340 - ultimate support at low of 313. This is very finely balanced and I am in Wait and See. No target but if it breaks up the 565 is on. I am very hopeful of this one as it is one of my watch list stocks.
As you can see my time scale is longer than most and I like my patterns to be visible 10 feet away!!
I await comments with some interest.
BTW I use Metastock for EOD and it is by far the best charting package. I have looked at several others and it's streets ahead, however it's whatever suits you. TBS stock scanning is easy peasy with MS.
FTSE Beater
Experienced member
- Messages
- 1,518
- Likes
- 6
Hi all
Yet again, apologies for the delay in getting back to you. 🙁
AV.

A lovely triangle developing here and depending on which way it breaks, governs my entry.
NI – I can see why you decided to go long at 392 but I would expect the trendline to hold it back. If 392 went, then I would think it would get to the trendline pretty quickly. Nice tight stop though, would soon get you out if you were wrong.
SoldierOfOne – I like the way your planning on trading this one. For your enty to be meet the trendline would have to be taken out, so the trade might be a long way off – maybe one for the watchlist.
Esiotrot – It is evident that your looking at a longer-term chart, so naturally you will be looking to hold the shares for longer as part of a portfolio, as apposed to trading – Nothing wrong with that at all 🙂
I agree with everything you have said. My worry would be that the bounces off the 310 mark are getting weaker (creating the descending triangle), so I would be looking for it to make a positive move upwards after testing 310.
BAY

Interesting chart with an ascending triangle being completed. The problem comes with the old support at 132, so once it breaks above the triangle, it will be instantly meet with resistance. I would be looking for a break of 132 to go long. On the short side, I would want a test of 132, followed by the trendline getting taken out on the way down.
NI – It looks like you plan on making a short-term trade on this. As I’ve said before, on that basis you should be looking at a 60min chart. Having said that, as a day trade it has possibilities as the price is heading upwards off the ascending triangle.
SoldierOfOne – Looks like a good trade plan. I agree the target to 125 is a bit short so maybe the trade isn’t on from there (unless you think the 125 level will get taken out).
Esiotrot – I can see what you mean about a BIG descending triangle. I think the downtrend line has now been broken (by the gap in early April). Would be great if the double bottom was completed 🙂
MRW

This stock made a large gap down in January, and gaps are naturally strong support and resistance points, so I would be looking for a short at around 200 with a tight stop just the other side.
NI – If the gap wasn’t there, then I would completely agree with you. 🙂
SoldierOfOne – I’ll go with that.
Esiotrot – Your right with your support and resistance points, and as you’re a longer term trader, MRW probably wouldn’t interest you – I know it wouldn’t interest me on a longer time-scale.
VOD

I would be looking to trade off the trendline, keeping an eye on the uptrend line, to make sure it didn’t hold strong. I doubt it would because the trendline is very steep.
NI – That’s ok, no-one says you have to have a view – thank you for being honest 🙂
SoldierOfOne – I wouldn’t call it a double top, because it isn’t “clean”, i.e. the 2 highs weren’t exactly the same, but it would give a good shorting place using the trendline as resistance.
Esiotrot – I would agree with that as a Long trade 🙂
Thank you once again to those who posted up their views – always interesting to see how different people read the same chart. It was also great to see how Esiotrot was using Technical Analysis for longer term trades. 🙂
Take care all.
Yet again, apologies for the delay in getting back to you. 🙁
AV.
A lovely triangle developing here and depending on which way it breaks, governs my entry.
NI – I can see why you decided to go long at 392 but I would expect the trendline to hold it back. If 392 went, then I would think it would get to the trendline pretty quickly. Nice tight stop though, would soon get you out if you were wrong.
SoldierOfOne – I like the way your planning on trading this one. For your enty to be meet the trendline would have to be taken out, so the trade might be a long way off – maybe one for the watchlist.
Esiotrot – It is evident that your looking at a longer-term chart, so naturally you will be looking to hold the shares for longer as part of a portfolio, as apposed to trading – Nothing wrong with that at all 🙂
I agree with everything you have said. My worry would be that the bounces off the 310 mark are getting weaker (creating the descending triangle), so I would be looking for it to make a positive move upwards after testing 310.
BAY
Interesting chart with an ascending triangle being completed. The problem comes with the old support at 132, so once it breaks above the triangle, it will be instantly meet with resistance. I would be looking for a break of 132 to go long. On the short side, I would want a test of 132, followed by the trendline getting taken out on the way down.
NI – It looks like you plan on making a short-term trade on this. As I’ve said before, on that basis you should be looking at a 60min chart. Having said that, as a day trade it has possibilities as the price is heading upwards off the ascending triangle.
SoldierOfOne – Looks like a good trade plan. I agree the target to 125 is a bit short so maybe the trade isn’t on from there (unless you think the 125 level will get taken out).
Esiotrot – I can see what you mean about a BIG descending triangle. I think the downtrend line has now been broken (by the gap in early April). Would be great if the double bottom was completed 🙂
MRW
This stock made a large gap down in January, and gaps are naturally strong support and resistance points, so I would be looking for a short at around 200 with a tight stop just the other side.
NI – If the gap wasn’t there, then I would completely agree with you. 🙂
SoldierOfOne – I’ll go with that.
Esiotrot – Your right with your support and resistance points, and as you’re a longer term trader, MRW probably wouldn’t interest you – I know it wouldn’t interest me on a longer time-scale.
VOD
I would be looking to trade off the trendline, keeping an eye on the uptrend line, to make sure it didn’t hold strong. I doubt it would because the trendline is very steep.
NI – That’s ok, no-one says you have to have a view – thank you for being honest 🙂
SoldierOfOne – I wouldn’t call it a double top, because it isn’t “clean”, i.e. the 2 highs weren’t exactly the same, but it would give a good shorting place using the trendline as resistance.
Esiotrot – I would agree with that as a Long trade 🙂
Thank you once again to those who posted up their views – always interesting to see how different people read the same chart. It was also great to see how Esiotrot was using Technical Analysis for longer term trades. 🙂
Take care all.
FTSE Beater
Experienced member
- Messages
- 1,518
- Likes
- 6
Hi all
This time around, I would like you to have a look at this chart.

This is not a stock, something slightly different. You should still be able to use Technical analysis in the same way to set targets and stops and trades etc 🙂
You can download the picture to edit by clicking here
Good luck with this one - and if anyone cares to take a guess at what it is, your more than welcome to have a go. 🙂
This time around, I would like you to have a look at this chart.
This is not a stock, something slightly different. You should still be able to use Technical analysis in the same way to set targets and stops and trades etc 🙂
You can download the picture to edit by clicking here
Good luck with this one - and if anyone cares to take a guess at what it is, your more than welcome to have a go. 🙂
Mark.
I would suggest Go long at 6325 with stop at 5770 risk55 points.
with target number one 6600 at point where the down trend line from November hits 6600 =Reward of 275 points. Target number two 7150 with a nice reward of 825 point. Bearing in mind its a log tem chart also we have a cup and handle from Feb to Apr.
Also the retracement from 7700 to 5775 is about 87% of the move from 5500 to 7700. Hope you can understand this because I cannot print the chart, cant get a Gif file on paint.
Look forward to your thoughts on this . Keep em coming .
Hi FB
Thanks for the comments. After retiring hurt :cheesy: I am now back to ask some questions.
Could you tell me, briefly, about triangles and gaps.
What they are?
How to spot them?
How to use them?
Many thanks
My take on the above chart is this:
A double (possibly triple) bottom in the shorter term at about 5680 gives a target of 6600, enter at 6325 with stop at 6230. I would use a moving stop to see if the downtrend is tested, at least to 6650 which shows previous support, and if so let this run to somewhere around 6900 (difficult chart to read the numbers exactly :cheesy: ) This gives a R/R of 2.9 - respectable.
Cheers
Attachments
Last edited:
My thoughts on the chart.
Sorry to be contrary but I would be looking to go short. This shows a long term downwards trend with no reversal at this point.
The short term is a nasty looking expanding triangle with volatility increasing. Several long term supply trendlines putting pressure on from above. It's difficult to whether this recent move has broken overhead resistance because you cannot be sure which is the important level. Certainly around 6600 is major resistance and this would be my stop. Minor resistance at 6400 would be a warning.
Short target has to be 5700 then ~5450. Reward to risk around 2:1
My concern would be the recent triple bottom and if it breaks up then I'm wrong (again).
However the daily range is upto 300pts!! so it needs watching.
I look for time cycles and this exhibits a 8 week (40 day) cycle. Retreat from a high next??
Funny looking bars with high, low and close only. How old is this?
FTSE Beater
Experienced member
- Messages
- 1,518
- Likes
- 6
Hi All
I'm going to be taking a complete break from trading for the next month, so this will be my last post for a while. 😢
NI - I'll cover triangles and gaps, when I'm trading again, but with gaps, they act as strong support and resistance places. Say a price gaps down from a low of day at £1 to opening at 90p. You would expect £1 to be tested at some point (it's not always the case, but it makes a good rule of thumb), only to fail and the price to then fall further. This is the sort of thing I mean.
http://www.trade2win.co.uk/gallery/showphoto.php?photo=29&password=&sort=7&thecat=522 The price gapped up at the open, retest the previous days high (which was the same as the close), and then carried on up 🙂
With regards the chart I posted up. It was the June contract for Coffee, which is why I presume there is only high low and close shown on the bars 🙂

I agree with what Esiotrot said about the longer term downtrend. I would however be looking at the double bottom as the possible reversal point, and be looking to go long whilst keeping a close eye on the trendlines 🙂
Fluke - Lovely stop placement and target 🙂 I'm not sure why you thought it was a log chart though, the scale is going up in equal increments. The other thing is that a C&H pattern should have a significantly larger cup than handle. Hope that makes sense
NI - I'll go with that, yet again a lovely tight stop 🙂
What the above chart goes to show is that you can use TA to look at any chart and take a view on it.
Take care, and happy trading 🙂
I'm going to be taking a complete break from trading for the next month, so this will be my last post for a while. 😢
NI - I'll cover triangles and gaps, when I'm trading again, but with gaps, they act as strong support and resistance places. Say a price gaps down from a low of day at £1 to opening at 90p. You would expect £1 to be tested at some point (it's not always the case, but it makes a good rule of thumb), only to fail and the price to then fall further. This is the sort of thing I mean.
http://www.trade2win.co.uk/gallery/showphoto.php?photo=29&password=&sort=7&thecat=522 The price gapped up at the open, retest the previous days high (which was the same as the close), and then carried on up 🙂
With regards the chart I posted up. It was the June contract for Coffee, which is why I presume there is only high low and close shown on the bars 🙂
I agree with what Esiotrot said about the longer term downtrend. I would however be looking at the double bottom as the possible reversal point, and be looking to go long whilst keeping a close eye on the trendlines 🙂
Fluke - Lovely stop placement and target 🙂 I'm not sure why you thought it was a log chart though, the scale is going up in equal increments. The other thing is that a C&H pattern should have a significantly larger cup than handle. Hope that makes sense
NI - I'll go with that, yet again a lovely tight stop 🙂
What the above chart goes to show is that you can use TA to look at any chart and take a view on it.
Take care, and happy trading 🙂
FTSE Beater
Experienced member
- Messages
- 1,518
- Likes
- 6
Thank you to those who contacted me and said they wanted me to re-start this thread. I hope you gain something useful from it. 🙂
Gaps
A gap in the market is caused by the price opening at a different price to when it closed. The majority of the time, the gap is very small and just gets filled quickly and it will not show up on the chart unless your looking really closely. The significant gaps are those that go beyond the previous days high and low.

The chart above shows how Dixons created a large gap in January. The difference between the open and the close was about 20%, so that is a very significant gap.
Up until now I’ve been looking at daily charts, but I’ll be switching over to shorter time-frames as there are a lot more gaps in intra-day trading than there are in longer-term trading. The principles are exactly the same.

This chart shows the 3 important levels that usually slows price down when it get near to these levels.
A = The previous days High. This is significant because it was a resistance point from the previous day. The price failed to go above it yesterday. As we have discussed earlier, resistance once broken will then turn into support.
B = The failed attempt to close the gap or failed attempt to fill the gap, results in a low for the day being made. It then attempted to break down again at 14:51 and failed. This then created a solid support line. You will notice it got broken at 18:21 and once the support had gone the price sharply fell to close the gap. This is the important bit, once the support has gone there is a large number of buyers looking to sell and gaps should get filled sharply once the initial support has gone.
C = This was the retest of A. At this point notice how the price stopped falling and reversed. The previous days resistance had held as support very well 🙂
Not all charts are this clean, but the idea behind it is still the same. Make sure you know where the previous days high and low are. Identify the support level, and make a trade based on what you expect to happen.
If it doesn't happen the way you expect, get out. Keep the risk as low as possible 🙂

The same applies to this chart. Point A was the previous days high. You could take either point B1 or B2 as the support the line. Personally I would go for B2 as that was the one that held at 19:20, and therefore confirms the support level 🙂
The difference is that at point C price did not stop, it carried on lower. If I were short I would close out at point C as that is the most logically stopping point.
I mentioned earlier that all gapping charts are not quite as clean as the ones above, and here’s an example of one that isn’t

The important thing to notice is how price reversed once the previous days low was hit. 🙂
I admit there is a lot more to cover with regards Gaps, and it could take awhile to learn all the possible gaps that there are. The ones I have explained above are just one area, but it’s the one I’ve had most success with.
Ok, here’s the Dixons chart that I posted up earlier only moved on by 6 months. Have a look at this chart and (for those who want to) post up any support and resistance levels that you see and also anything else that stands out from the chart. 🙂

As always there is no right or wrong answers and I would love to hear from you.
Take care,
Gaps
A gap in the market is caused by the price opening at a different price to when it closed. The majority of the time, the gap is very small and just gets filled quickly and it will not show up on the chart unless your looking really closely. The significant gaps are those that go beyond the previous days high and low.
The chart above shows how Dixons created a large gap in January. The difference between the open and the close was about 20%, so that is a very significant gap.
Up until now I’ve been looking at daily charts, but I’ll be switching over to shorter time-frames as there are a lot more gaps in intra-day trading than there are in longer-term trading. The principles are exactly the same.
This chart shows the 3 important levels that usually slows price down when it get near to these levels.
A = The previous days High. This is significant because it was a resistance point from the previous day. The price failed to go above it yesterday. As we have discussed earlier, resistance once broken will then turn into support.
B = The failed attempt to close the gap or failed attempt to fill the gap, results in a low for the day being made. It then attempted to break down again at 14:51 and failed. This then created a solid support line. You will notice it got broken at 18:21 and once the support had gone the price sharply fell to close the gap. This is the important bit, once the support has gone there is a large number of buyers looking to sell and gaps should get filled sharply once the initial support has gone.
C = This was the retest of A. At this point notice how the price stopped falling and reversed. The previous days resistance had held as support very well 🙂
Not all charts are this clean, but the idea behind it is still the same. Make sure you know where the previous days high and low are. Identify the support level, and make a trade based on what you expect to happen.
If it doesn't happen the way you expect, get out. Keep the risk as low as possible 🙂
The same applies to this chart. Point A was the previous days high. You could take either point B1 or B2 as the support the line. Personally I would go for B2 as that was the one that held at 19:20, and therefore confirms the support level 🙂
The difference is that at point C price did not stop, it carried on lower. If I were short I would close out at point C as that is the most logically stopping point.
I mentioned earlier that all gapping charts are not quite as clean as the ones above, and here’s an example of one that isn’t
The important thing to notice is how price reversed once the previous days low was hit. 🙂
I admit there is a lot more to cover with regards Gaps, and it could take awhile to learn all the possible gaps that there are. The ones I have explained above are just one area, but it’s the one I’ve had most success with.
Ok, here’s the Dixons chart that I posted up earlier only moved on by 6 months. Have a look at this chart and (for those who want to) post up any support and resistance levels that you see and also anything else that stands out from the chart. 🙂
As always there is no right or wrong answers and I would love to hear from you.
Take care,
Similar threads
- Replies
- 3
- Views
- 5K